

Mankind has long lived in cities. For convenience, safety or confort, there has been this urge to come together in ever-growing population centers. They are not all the same, however. Anyone that has travelled somewhat extensively been in quite a few of them has this feeling of different cities having their own dynamics and personality.
Many factors contribute to this. The services in place, how people use them, the location of certain features, all play a role. At a deeper level, though, the city's own structure, how its streets and neigbourhoods are organized and laid out, is sure to play a role. For all their artificialness, they grow and evolve almost as living organisms. Their current shapes depend on their age, the original "skeleton" set up by its initial settlers, the avaliable space and many other things. Wanting to know more about this I set out to find differences between cities around the world.
Mankind has long lived in cities. For convenience, safety or comfort, there has been this urge to come together in ever-growing population centers. They are not all the same, however. Anyone who has travelled somewhat extensively has this feeling of different cities having their own dynamics and personality.
Many factors contribute to this. The services in place, how people use them, the location of certain features, all play a role. At a deeper level, though, the city's own structure, how its streets and neighbourhoods are organized and laid out, is sure to play a role. For all their artificialness, they grow and evolve almost as living organisms. Their current shapes depend on their age, the original "skeleton" set up by its initial settlers, the available space and many other things. Wanting to know more about this I set out to find differences between cities around the world.
How to read the maps
I took the streets of 41 cities from OpenStreetMap (a late 2014 snapshot, some 154,000 km of street in all) and scored each street on one simple thing: how much it turns, on average, at each point along its length. The straighter the street, the redder it is drawn; the more it winds, the greener. Dashed lines are footpaths, and water is the blue-grey background. Nothing else is encoded: no traffic, no population, no age.
That is all it takes for a city's history to show up. Below, "red share" means the share of a city's street length that turns less than about 5° per point, which comes out red or orange.
Old world, new world
The Americas really are redder. Their twelve cities average a red share of 71%, against 50% for the fourteen European ones. Buenos Aires (86%), Philadelphia (82%) and Chicago (81%) lead the whole list, all three laid out on a grid from early on: Garay's in 1580, Penn's in 1682, the American land survey's in the 1830s.
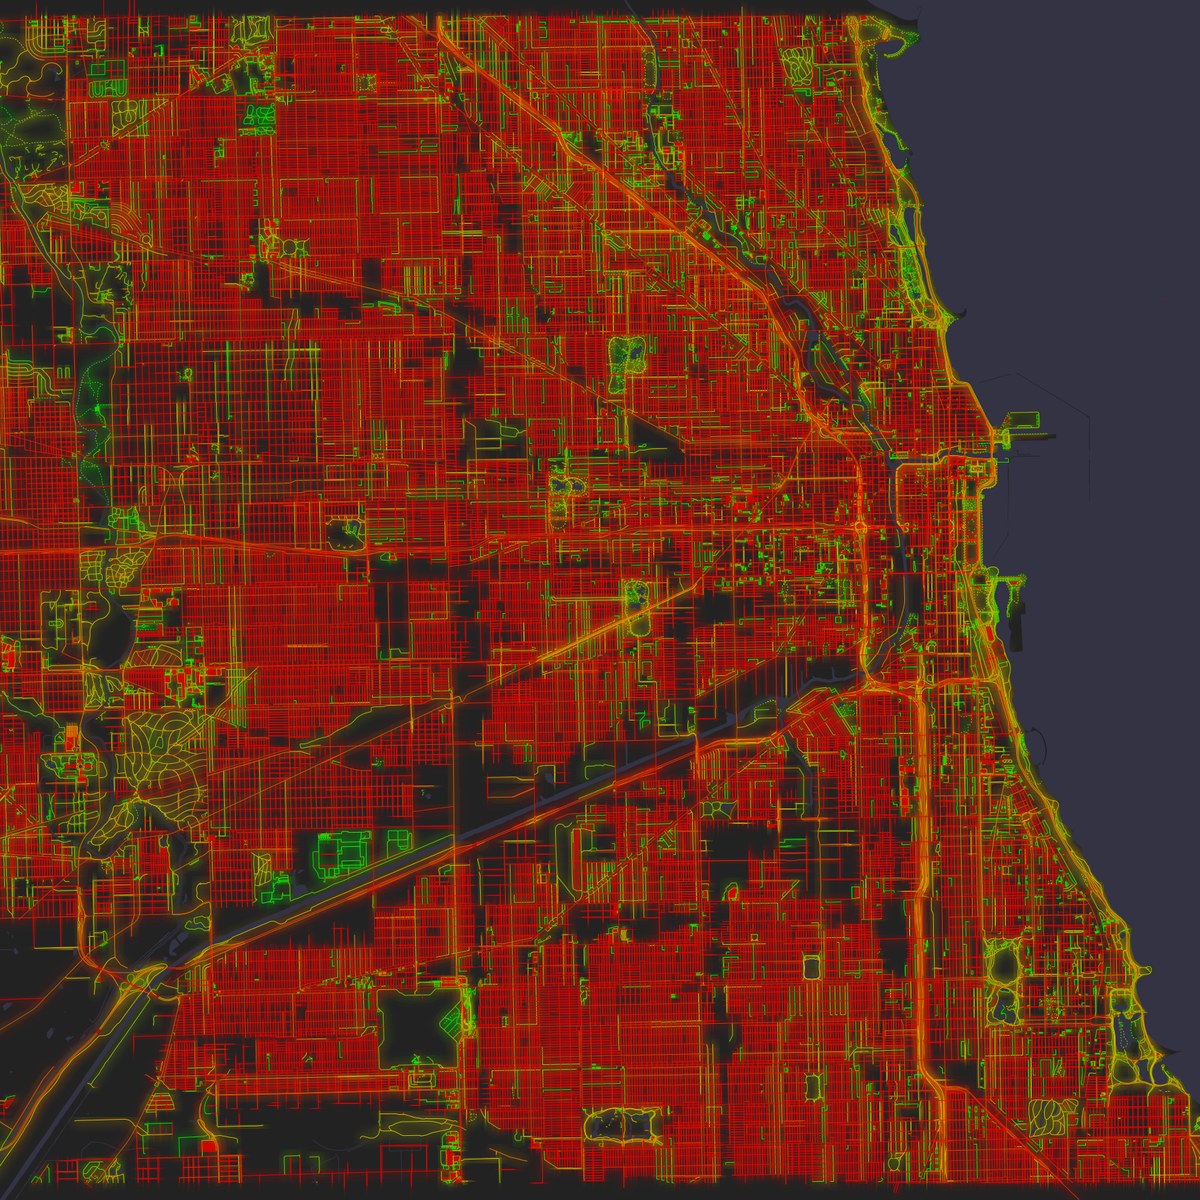
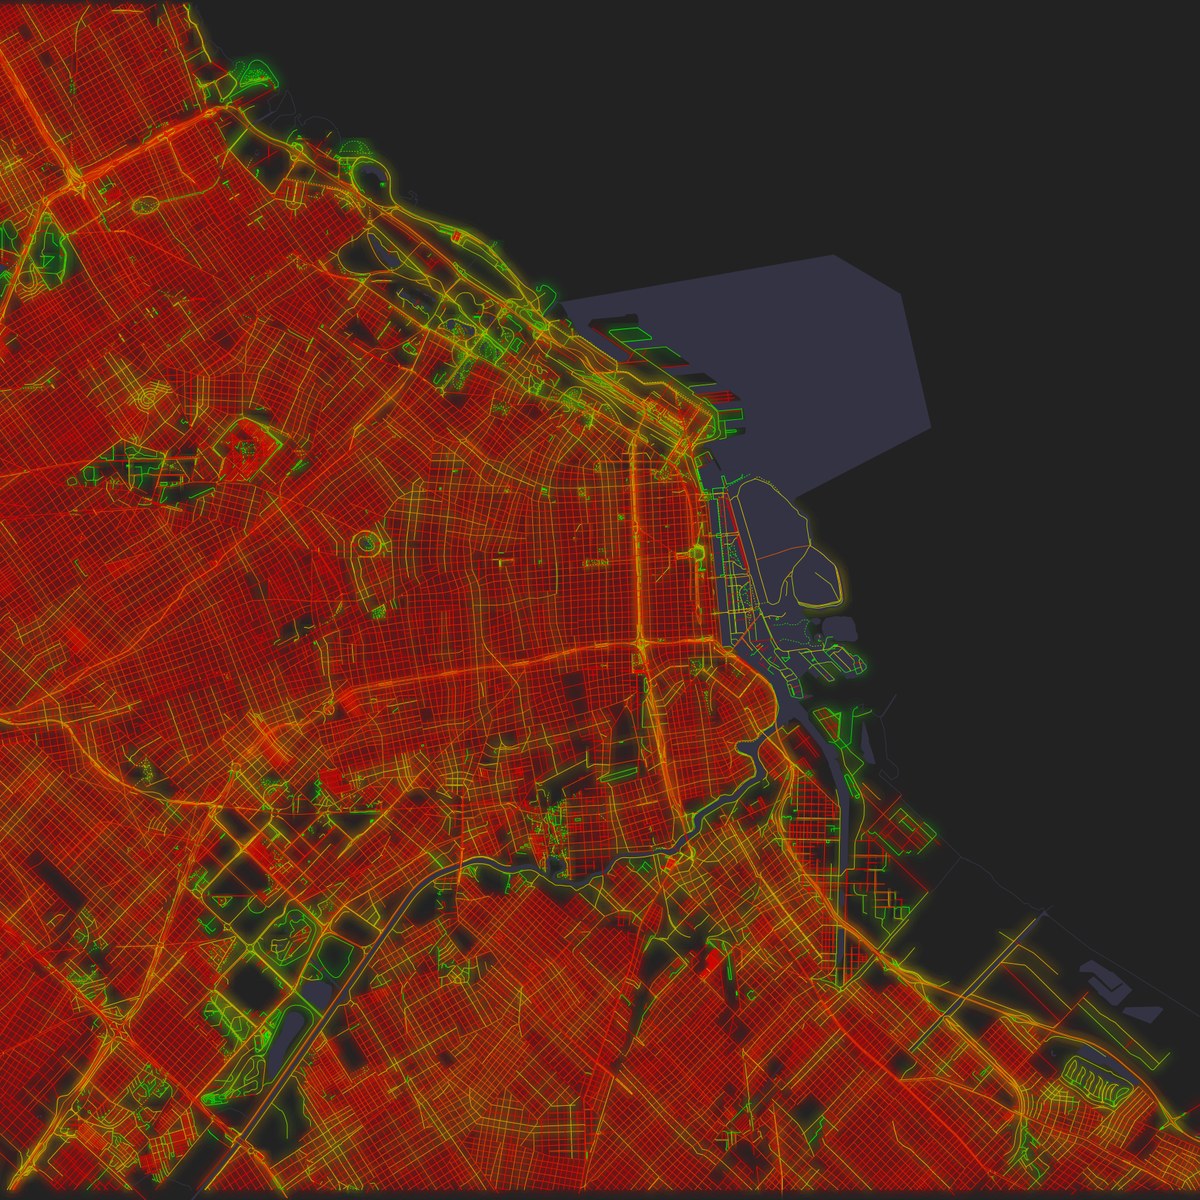
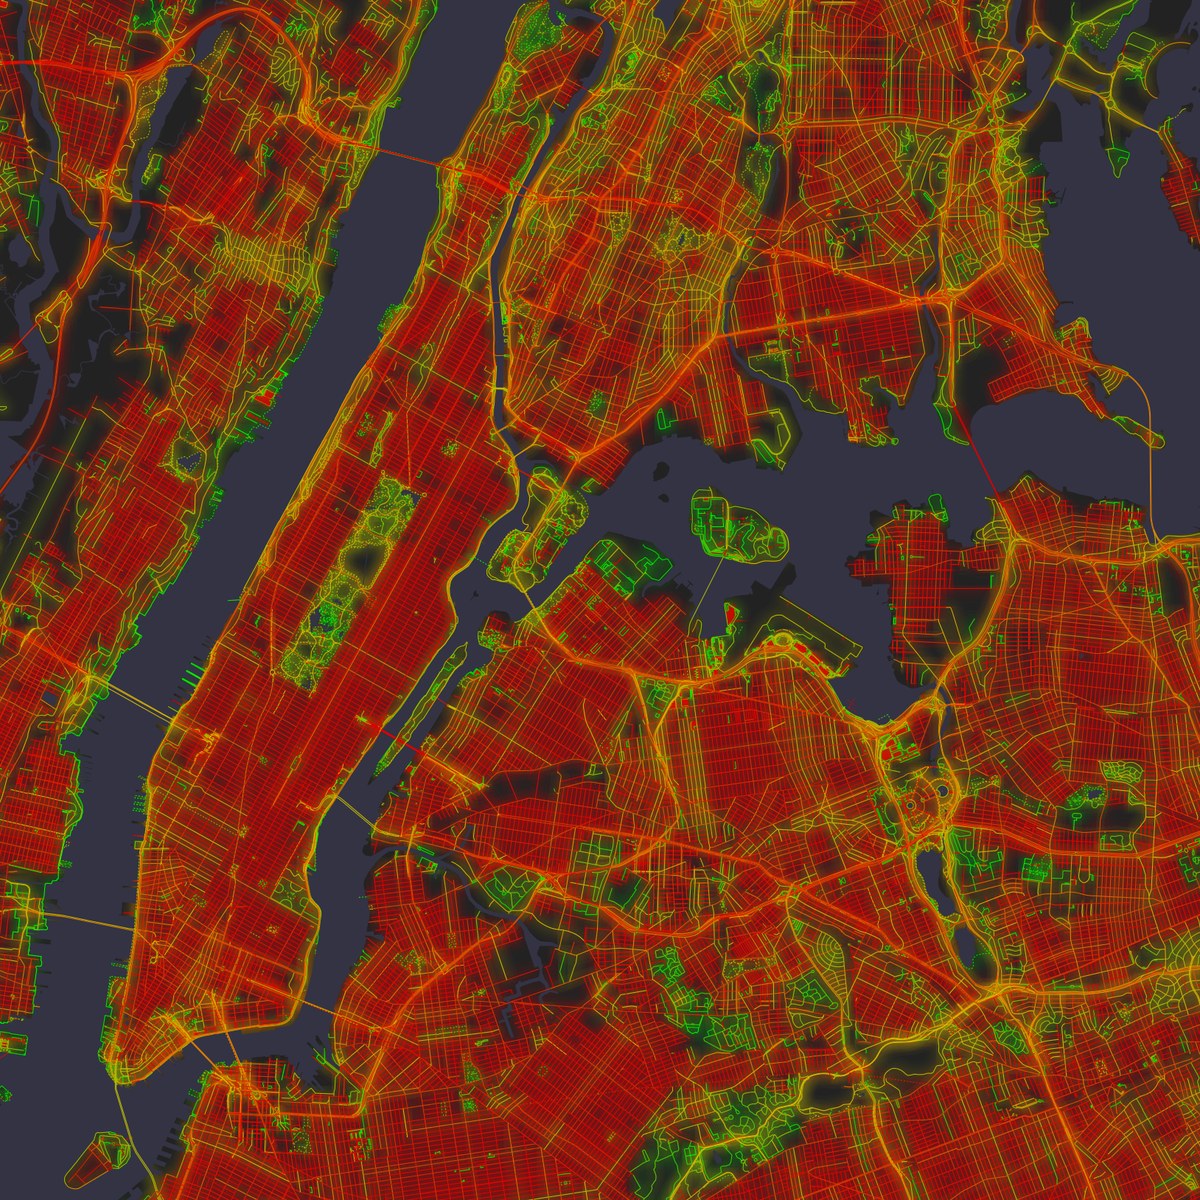
Chicago, Buenos Aires and New York.
Europe looks different: finer, more mottled, with no large single block of colour. No European city gets past 64%, and that takes Amsterdam, Berlin or Paris, all heavily replanned at some point.
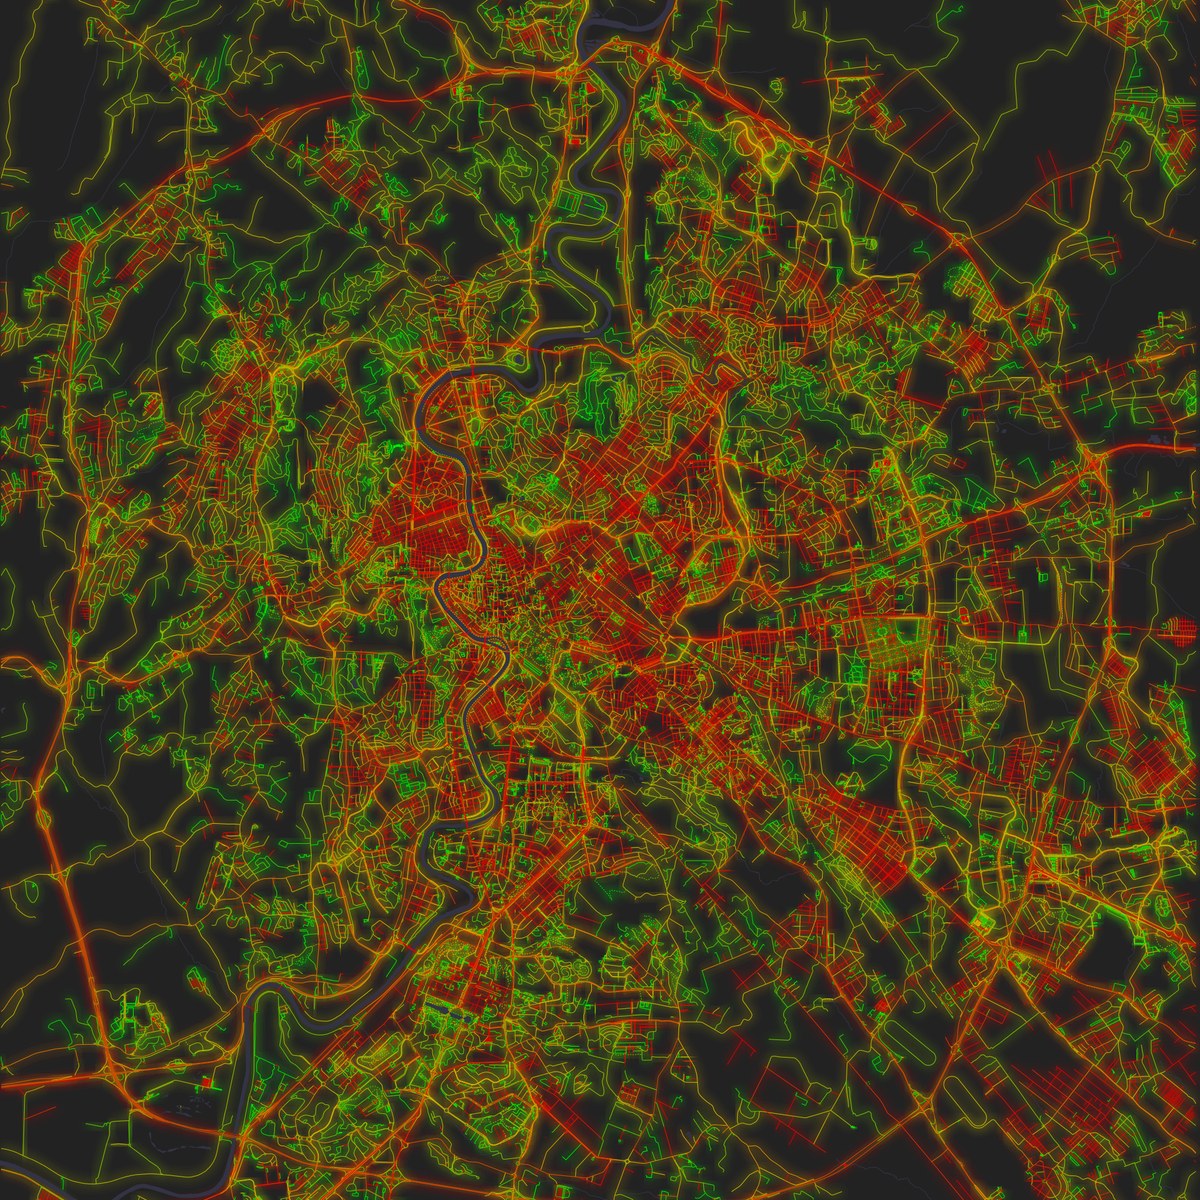
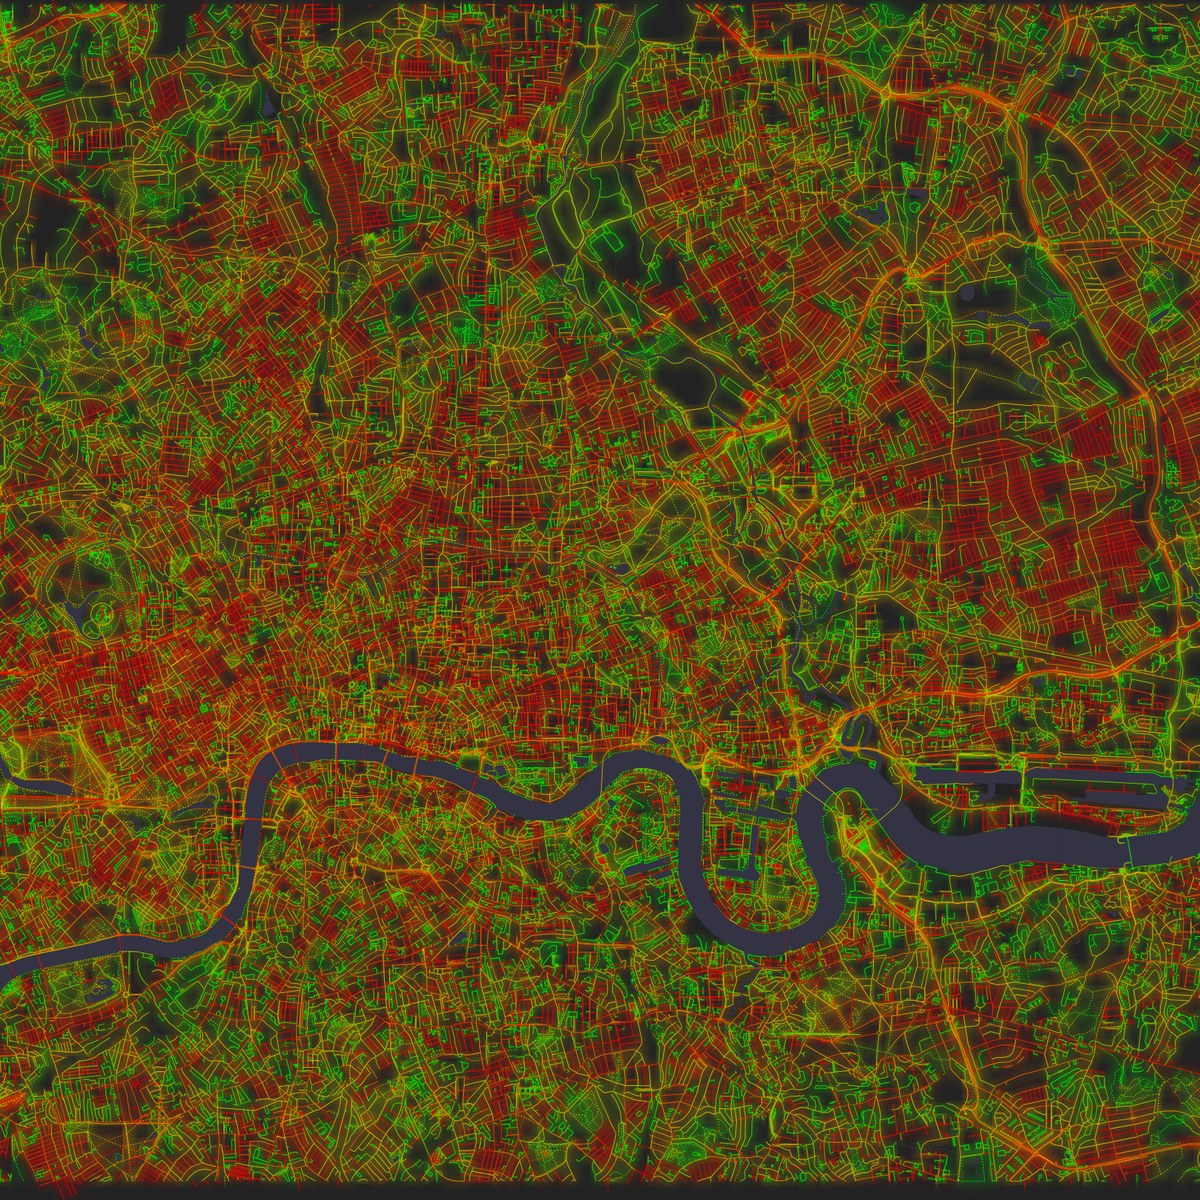
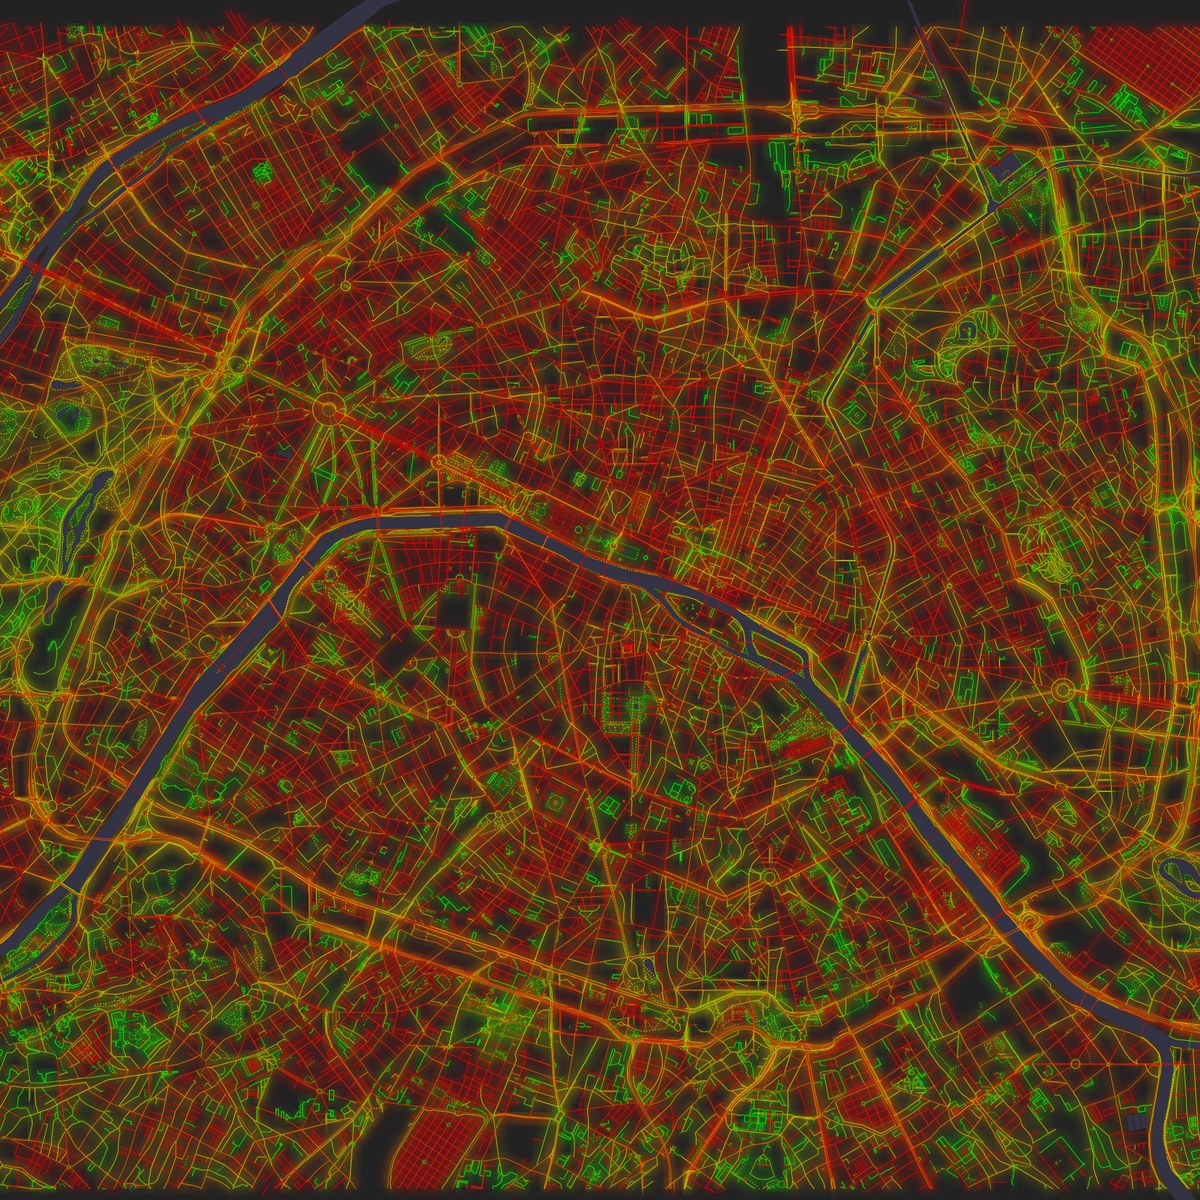
Rome, London and Paris.
It is a tendency and not a law, though. Rio de Janeiro (53%) and La Paz (55%) are as green as Europe, and Beijing, whose chessboard goes back to the 13th century, scores 68%. Addis Ababa was only founded in 1886, and it is among the greenest of all, at 36%. Age alone doesn't explain much.
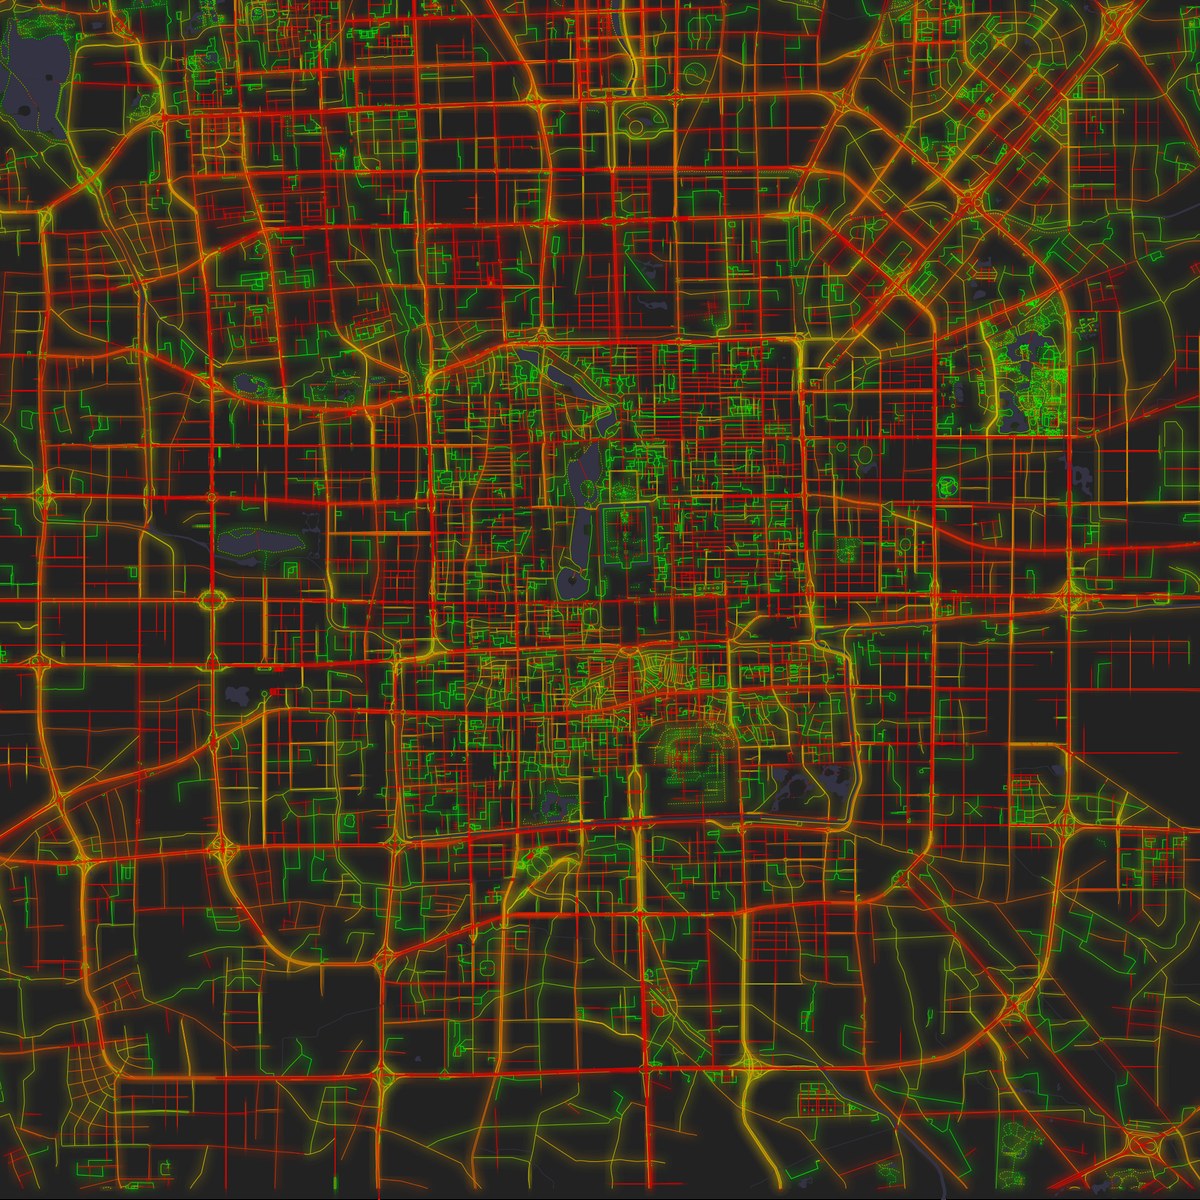
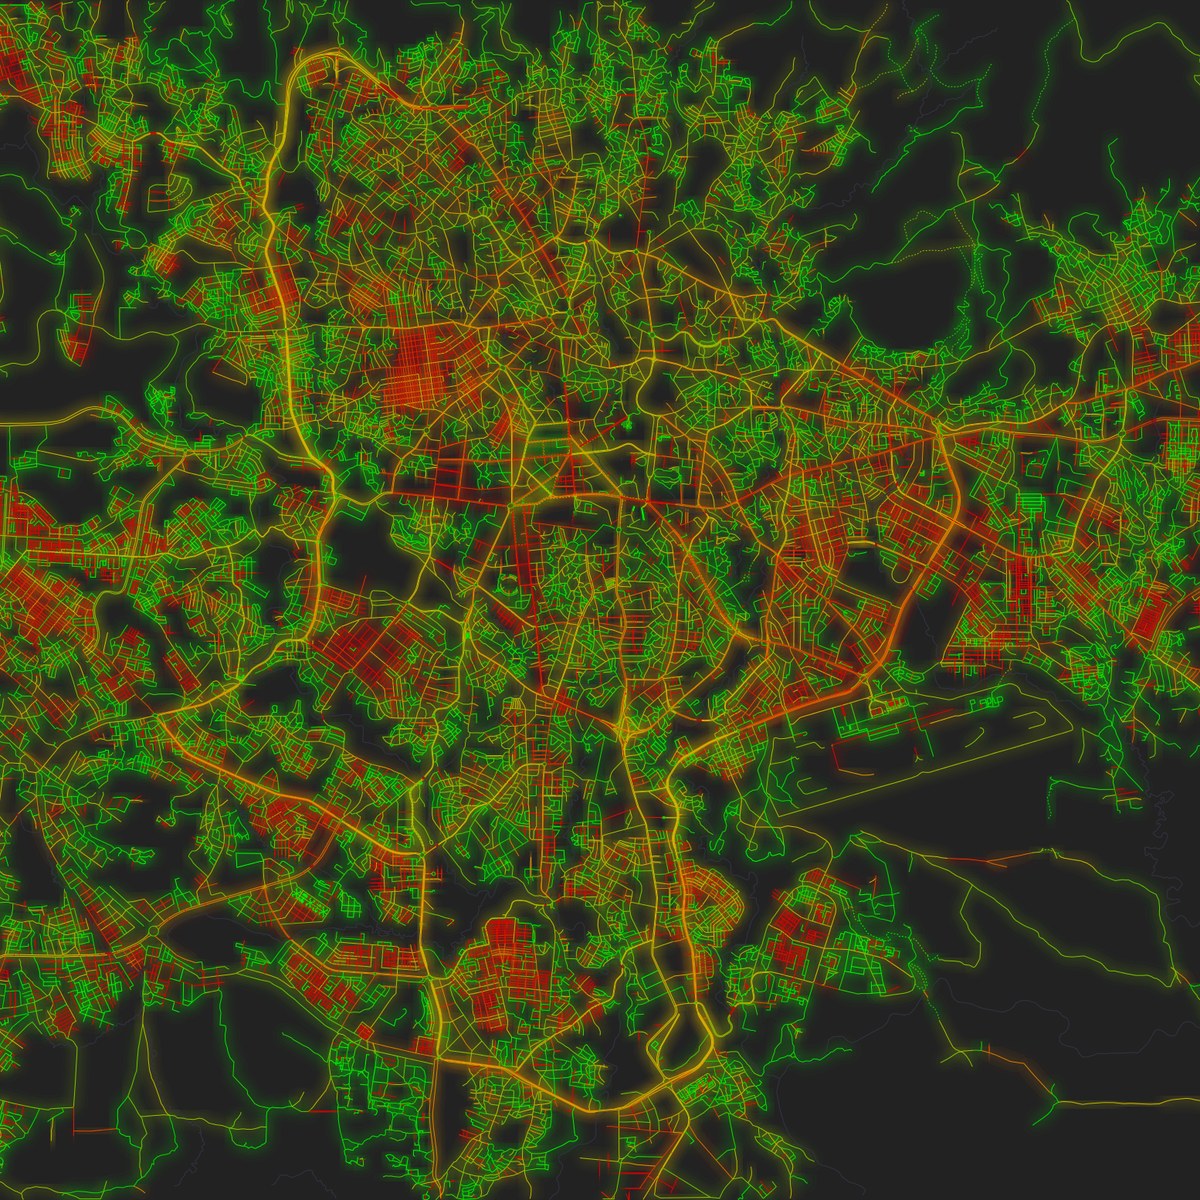
Beijing, old and red. Addis Ababa, young and green.
Planned is not the same as straight
Planned cities should be the reddest of all, and some are. Islamabad, laid out in the 1960s as a grid of sectors, reaches 66%. But Brasília, also from scratch and from the same years, stays at 50%, because Lúcio Costa's plan bends along its great curved axis. And Canberra, which Walter Burley Griffin and Marion Mahony Griffin designed in circles and arcs set into the landscape, comes out at just 37%, one of the lowest on the list and greener than old Rome. These maps can't tell a plan from no plan. What they show is the kind of plan: a planner's curve and a medieval lane look the same to a measure of straightness.
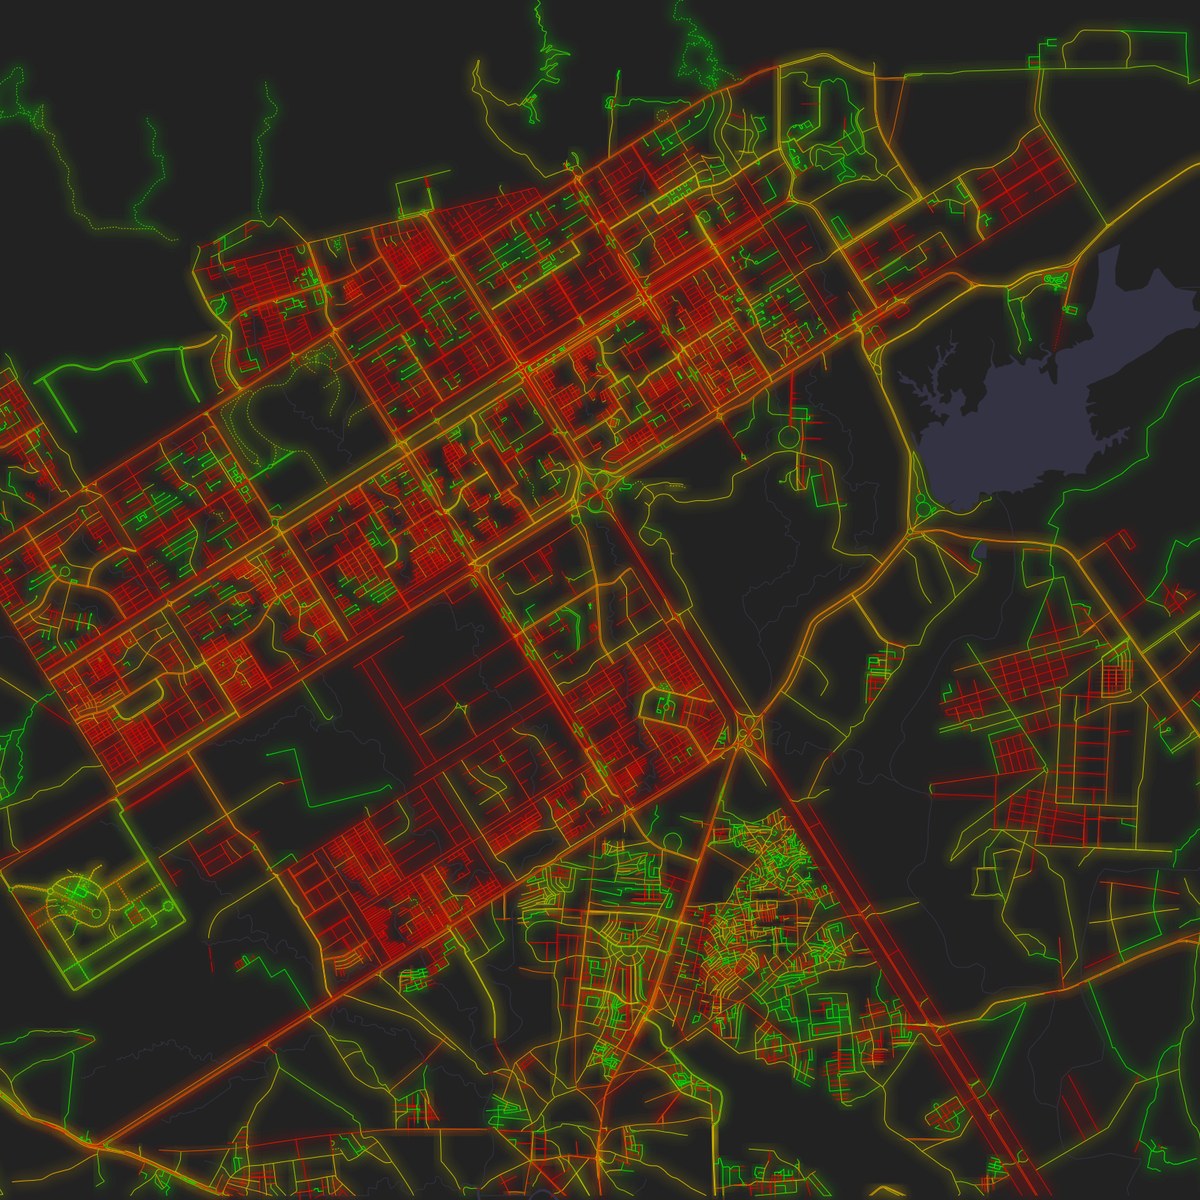
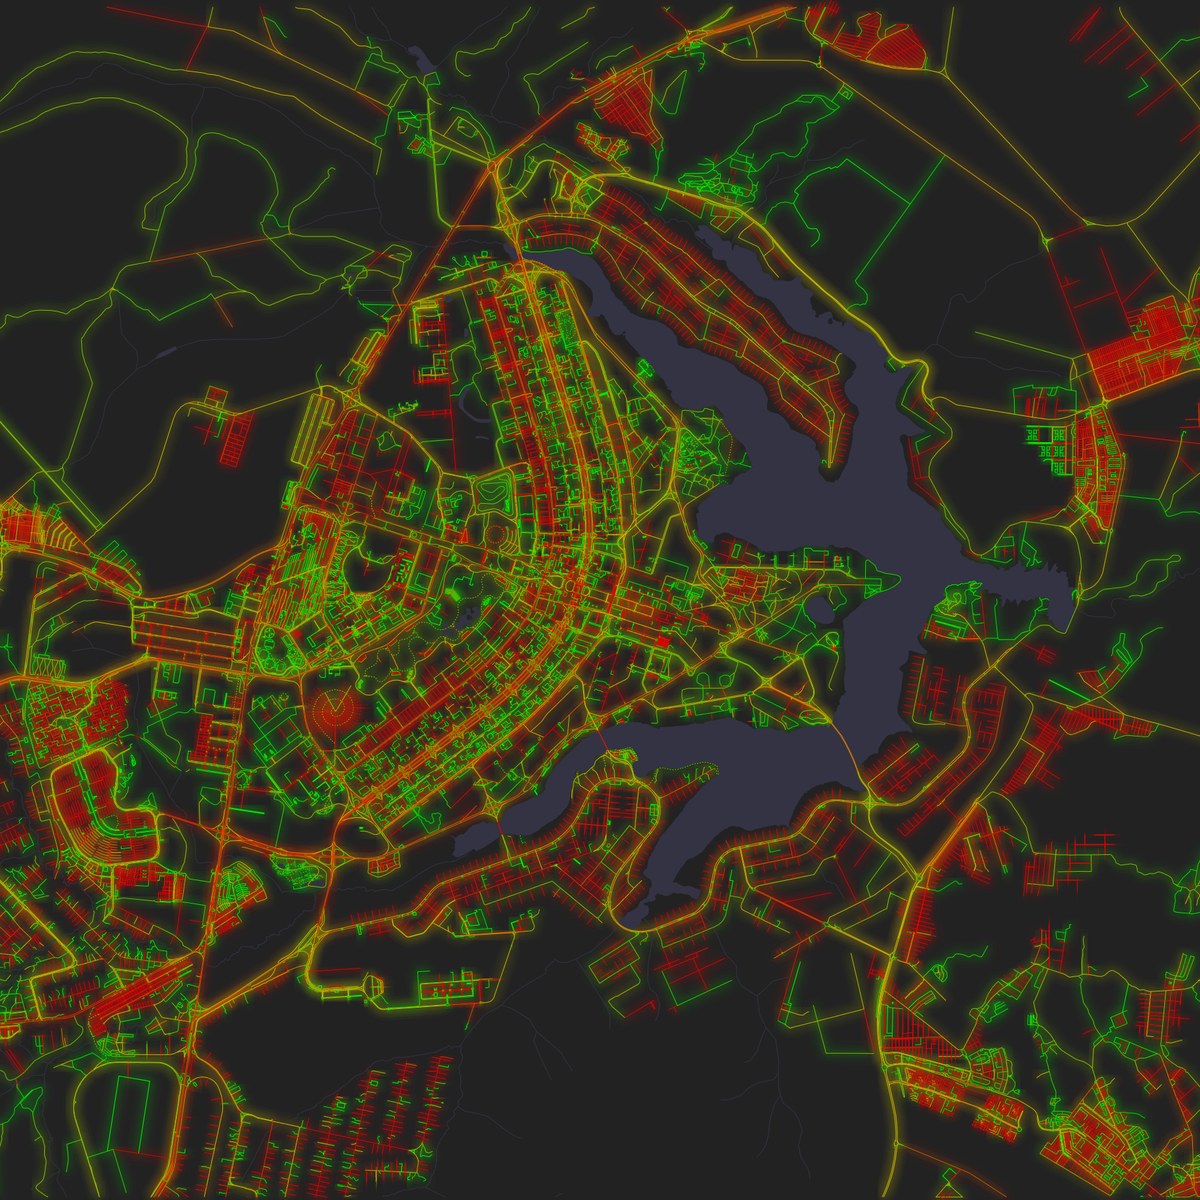
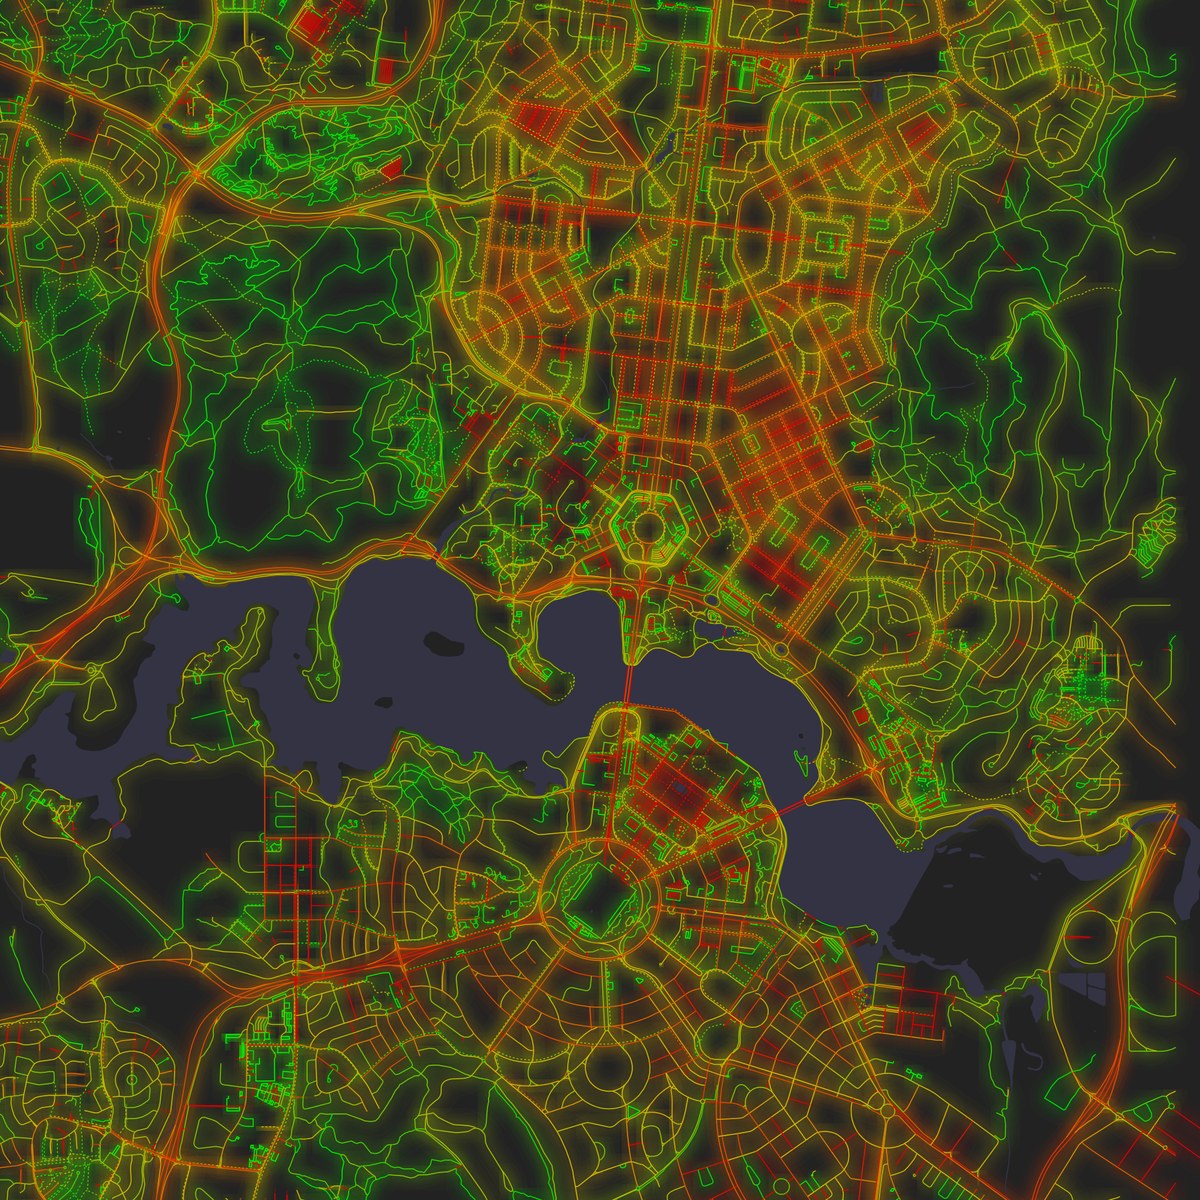
Three capitals drawn from scratch: Islamabad, Brasília and Canberra.
The reverse trap also exists: red doesn't always mean planned. Venice comes out at a surprising 57%, but its streets are the shortest in the set, 69 m on average, and each little stretch between two corners is nearly straight. Keep only the streets over 200 m and it falls to 46%. Rome's historic centre (62%) is redder than Rome as a whole (50%) for much the same reason. What tells a grid apart is not how straight its streets are but whether they agree on a direction. Measured that way, Chicago is by far the most ordered city in the set and Rome the least. New York, despite its 77% red share, ranks low: Manhattan's grid and those of Brooklyn and Queens are all straight, but each points its own way.
The ground decides
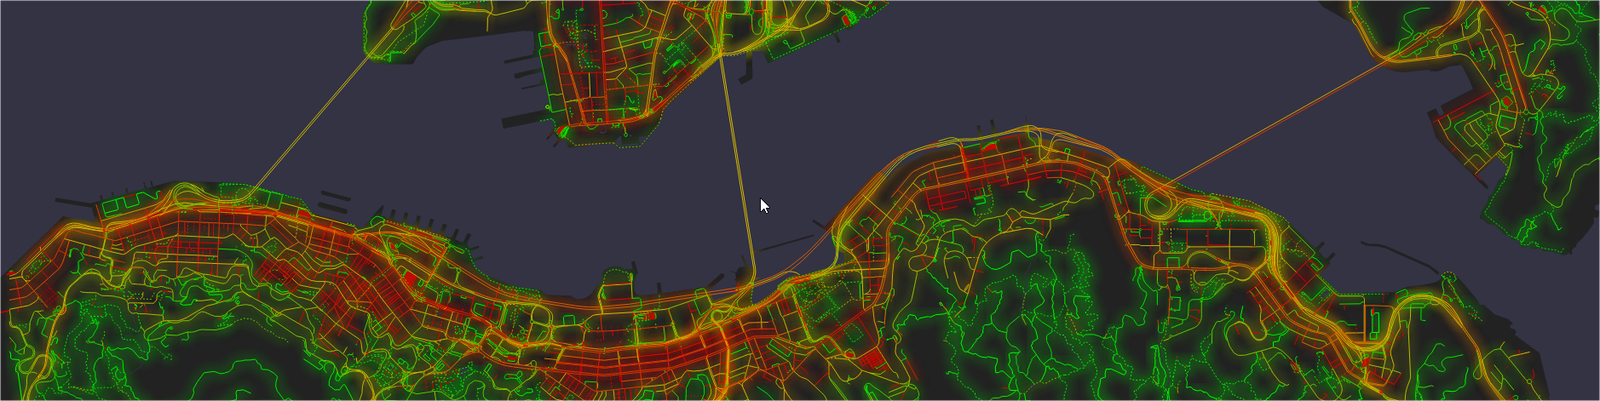
The sharpest contrasts of all are inside a single city, and they mostly follow the terrain. In La Paz, the neighbourhoods up on the flat plateau of El Alto are 79% red, while the streets falling into the canyon below are 32%; the boundary between them can be traced on the map as the edge of the plateau. San Francisco lays its grid across the flat Sunset district (87%), but gives up around Twin Peaks (35%). Hong Kong goes from 62% along the Central waterfront to 18% up on the Peak.
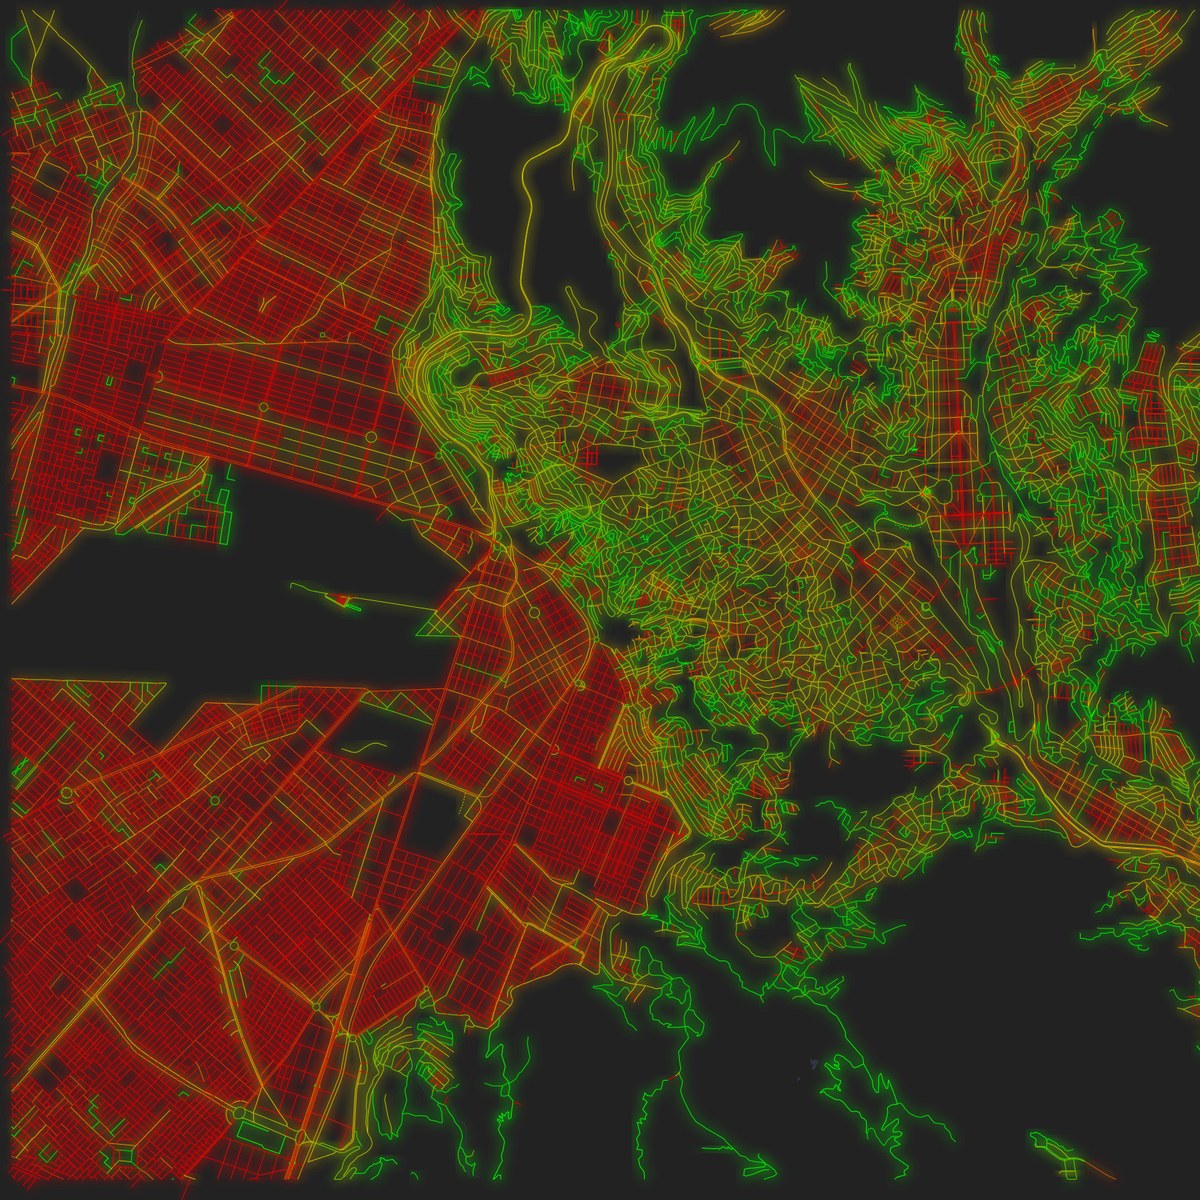
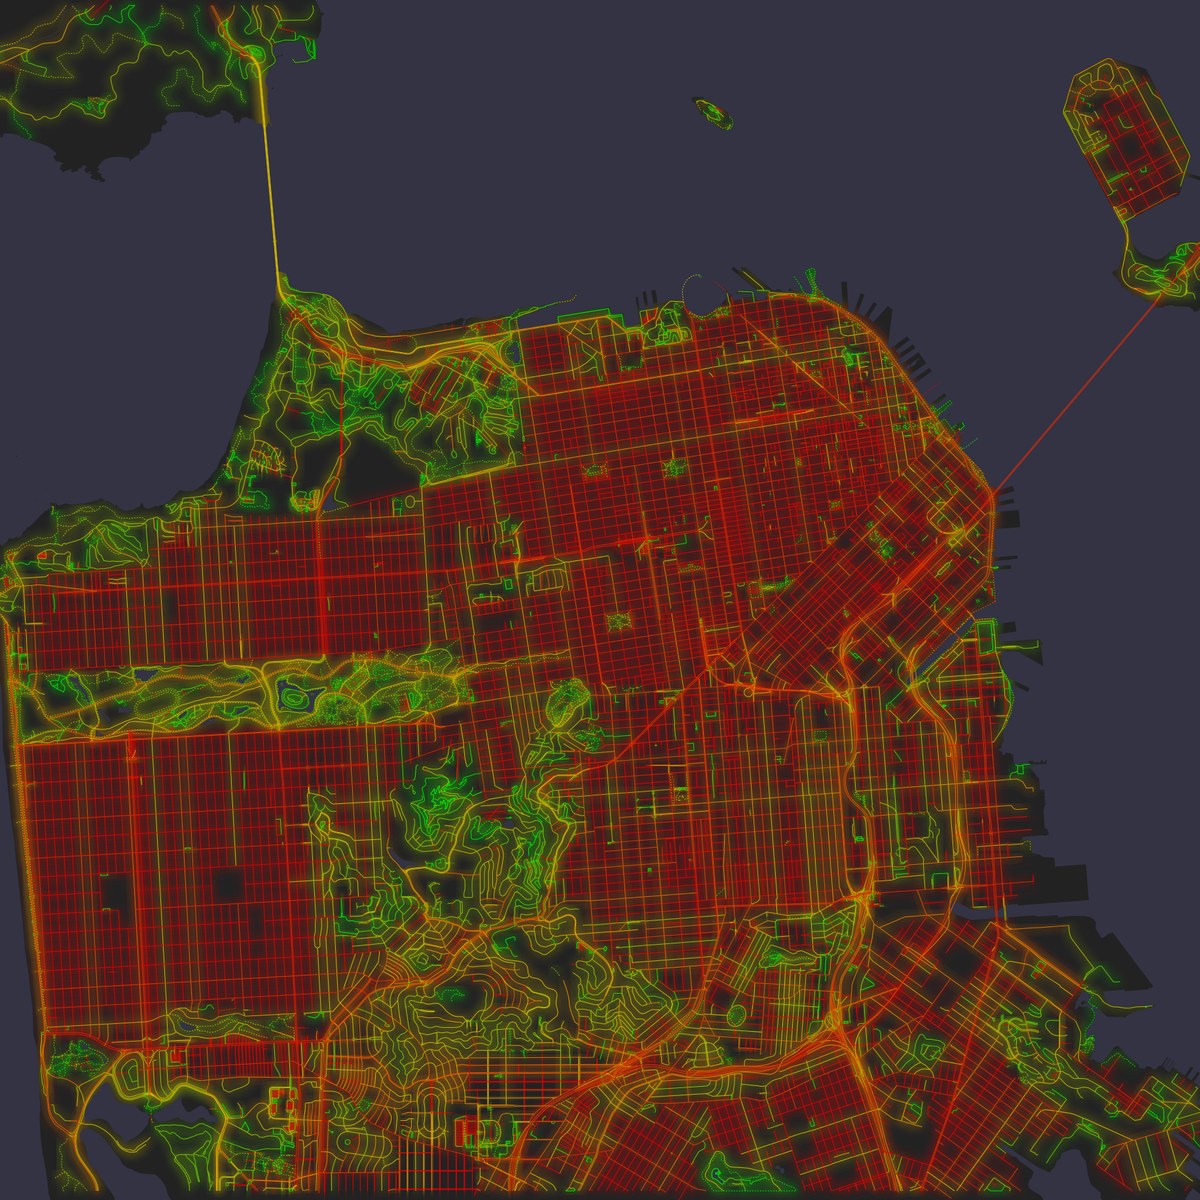
La Paz and San Francisco: the colour changes where the slope does.
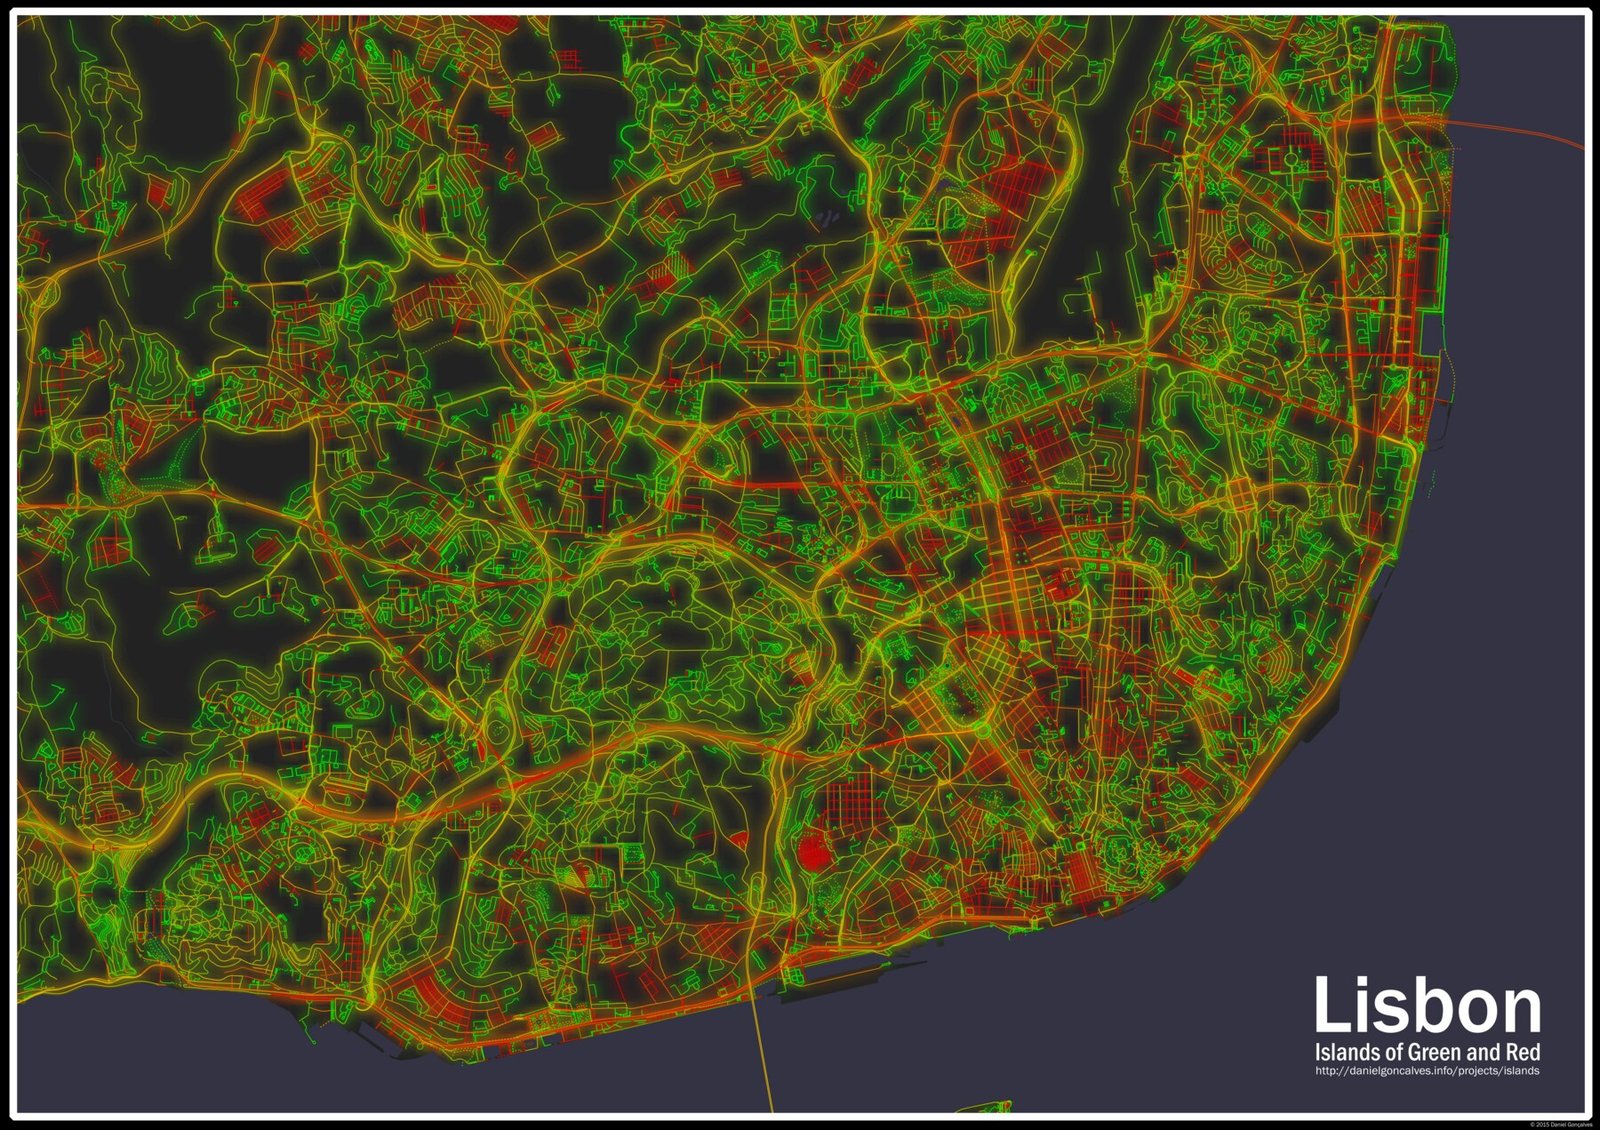
Portugal, with its hills, shows this well. Coimbra has the lowest red share of all 41 cities (24%), with Lisbon (39%) and Porto (40%) not far behind. So it's all the more striking to find, in the same country, Vila Real de Santo António, a town built in a matter of months in 1774. Its core has a red share of 82%, and it sits on the map like a stamp.
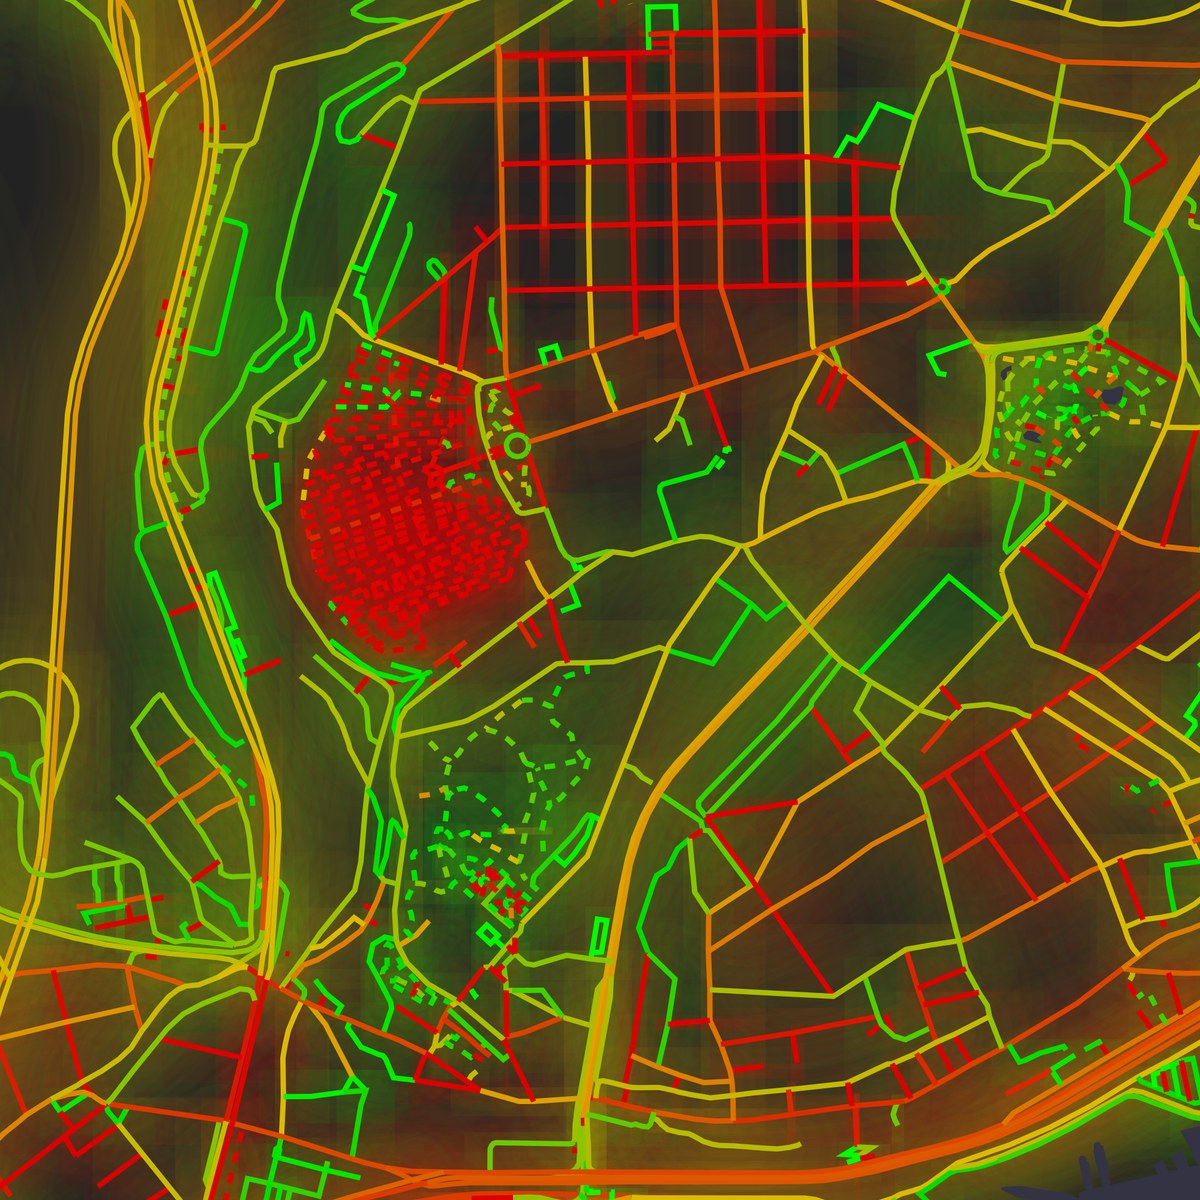
Lisbon holds both stories at once. After the 1755 earthquake the Baixa was rebuilt as a grid, under the same Marquis of Pombal who would then found Vila Real. It reaches 59%, while the Alfama, right beside it, which the earthquake largely spared, stays at 31%. You can see the two meet below the castle.
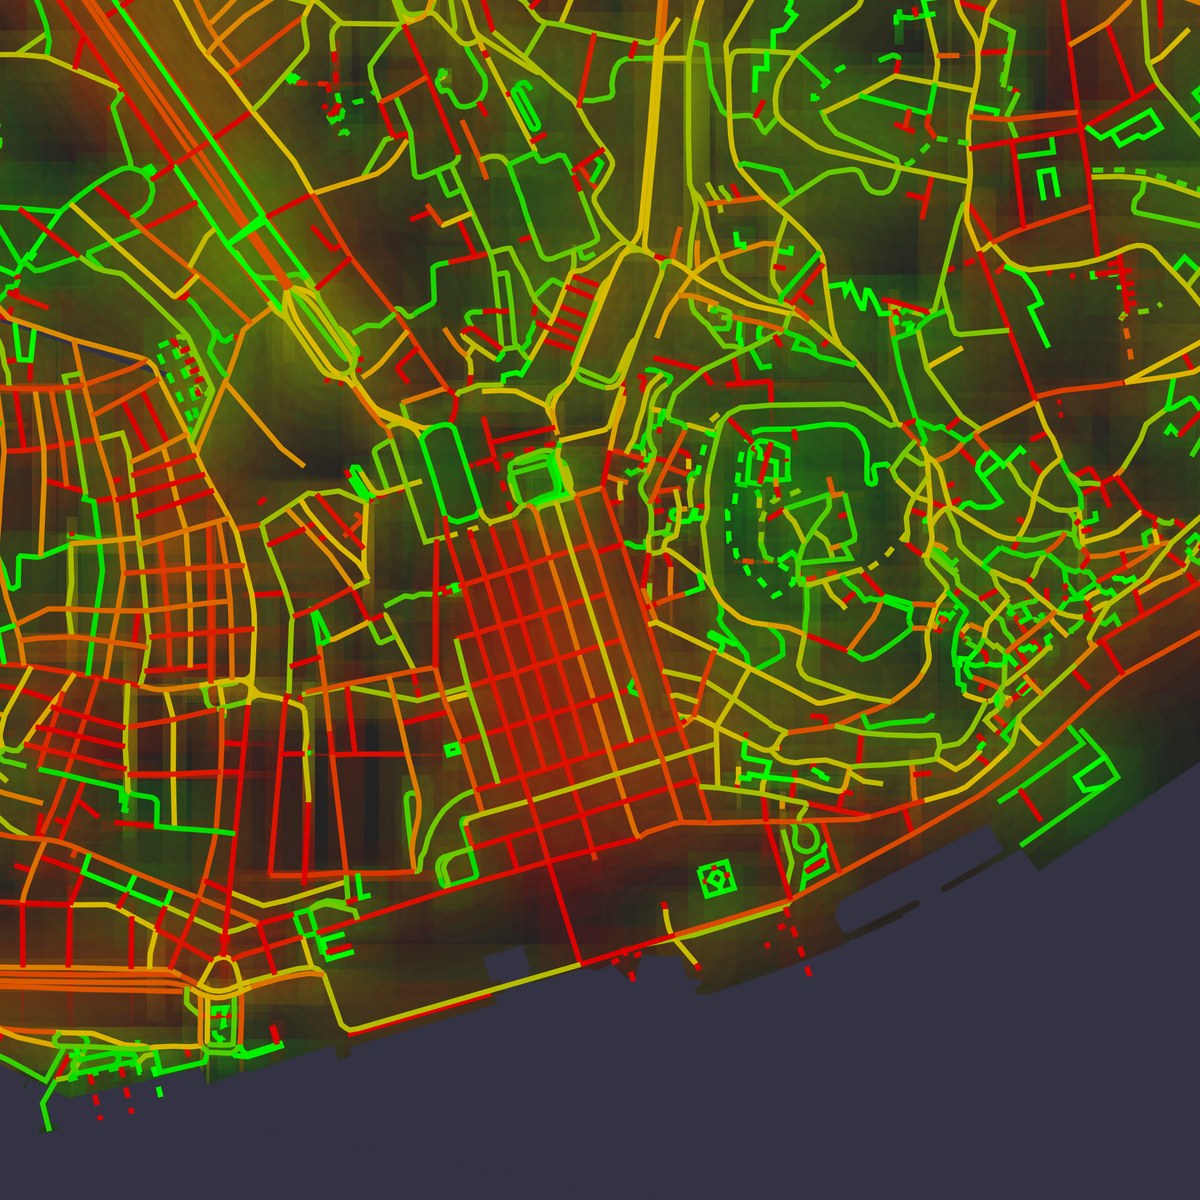
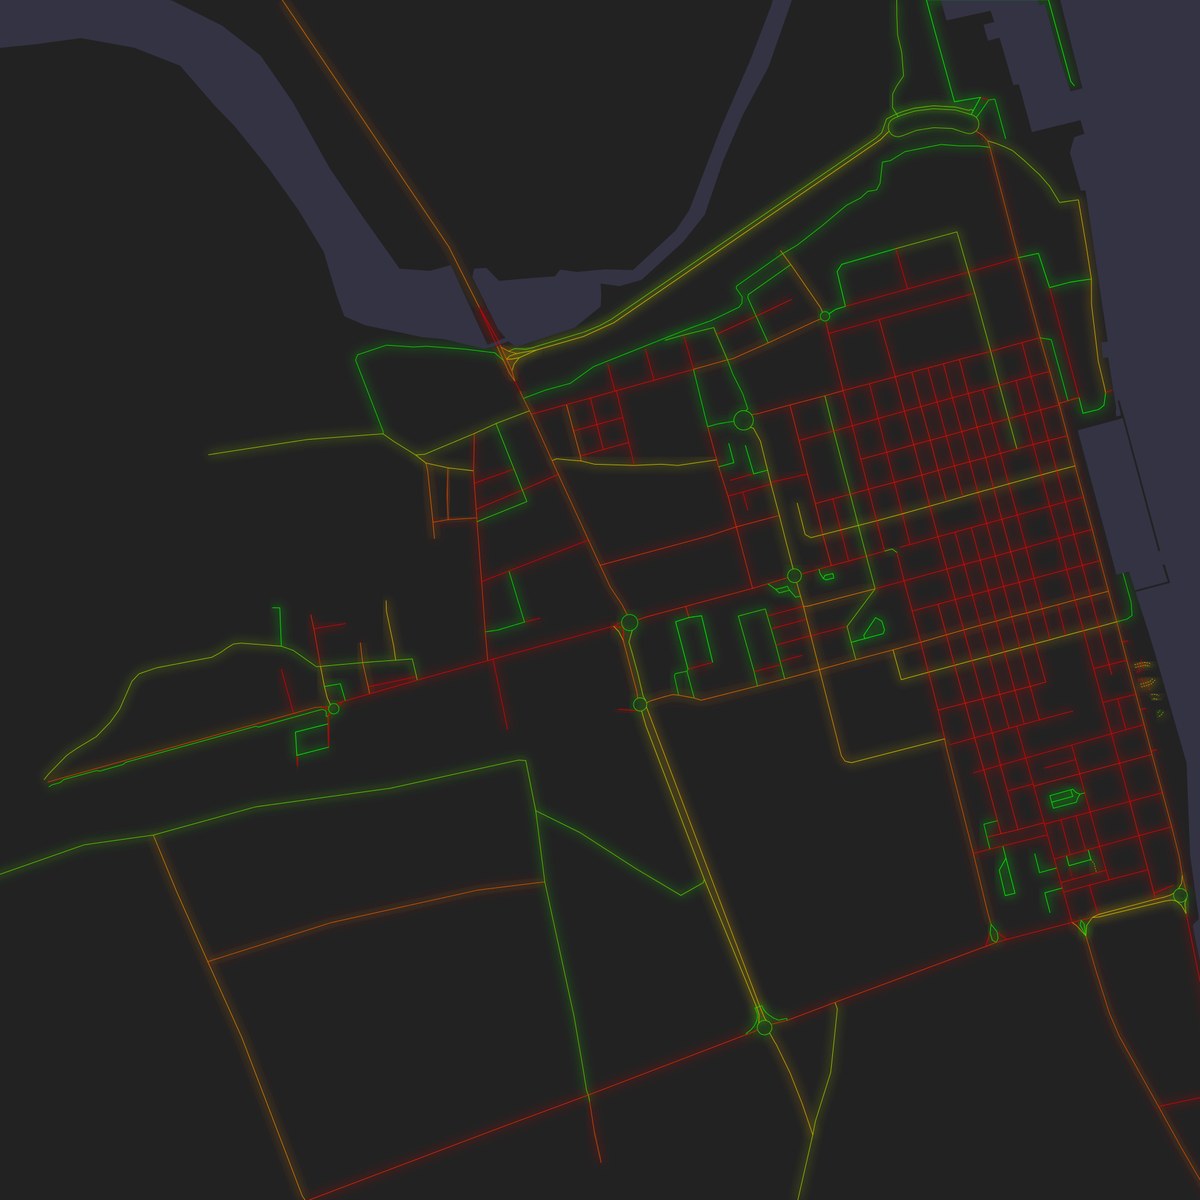
Two grids from Pombal's time: Lisbon's Baixa, next to the castle hill, and Vila Real de Santo António.
And then there are the small surprises that make a map like this fun to explore. That solid red blot in western Lisbon, for instance, is the Prazeres cemetery, whose rows of graves are straight little footpaths in the data, just under the regular grid of Campo de Ourique.
Islands
Which explains the name. Seen from far enough, few cities are simply red or simply green. They are archipelagos: islands of red, where someone once drew a plan on flat ground, in a sea of green where the streets just found their way around the hills, or the other way around. Once you see them, it is hard to look at a city map any other way.
The numbers
Red share of street length, for the cities at the two ends of the list:
| Straightest | Red share | Most winding | Red share | |
|---|---|---|---|---|
| Buenos Aires | 86% | Coimbra | 24% | |
| Philadelphia | 82% | Faro | 36% | |
| Chicago | 81% | Addis Ababa | 36% | |
| Bogotá | 79% | Canberra | 37% | |
| New York | 77% | Lisbon | 39% |
A few things to keep in mind. The score is per point along a street, so a street drawn with only two points always counts as perfectly straight, and how carefully a place was mapped in 2014 has some influence. More than half of Bogotá's streets score exactly zero, for instance, which looks more like sparse mapping than a perfect city. The areas also differ in size, and were picked by hand, so a map that reaches further into the countryside gets greener. The neighbourhood figures come from rough boxes drawn around each area. Treat all of this as a way of looking at cities, not as a measurement of them.