
Smartphones now record where we go all day, effortlessly. Yet when we want to look at that record, we do it later, at a desk, far from the places it talks about. The tools for consulting these lifelogs are still desktop tools: data are captured on the move but explored somewhere else.
MySteps, a platform developed over the years at Técnico, combines GPS tracks with personal semantics (where, what and why) written in the LIFE format. It is very good at processing and annotating a day on a large screen, but it was not made for answering a quick question in the street: where have I been around here? when was I last at that market?
Retrace MySteps is a mobile companion for MySteps, built as a Progressive Web App. Instead of squeezing the desktop interface onto a phone, we started from the five questions people bring to their records away from a desk, and designed one screen for each.
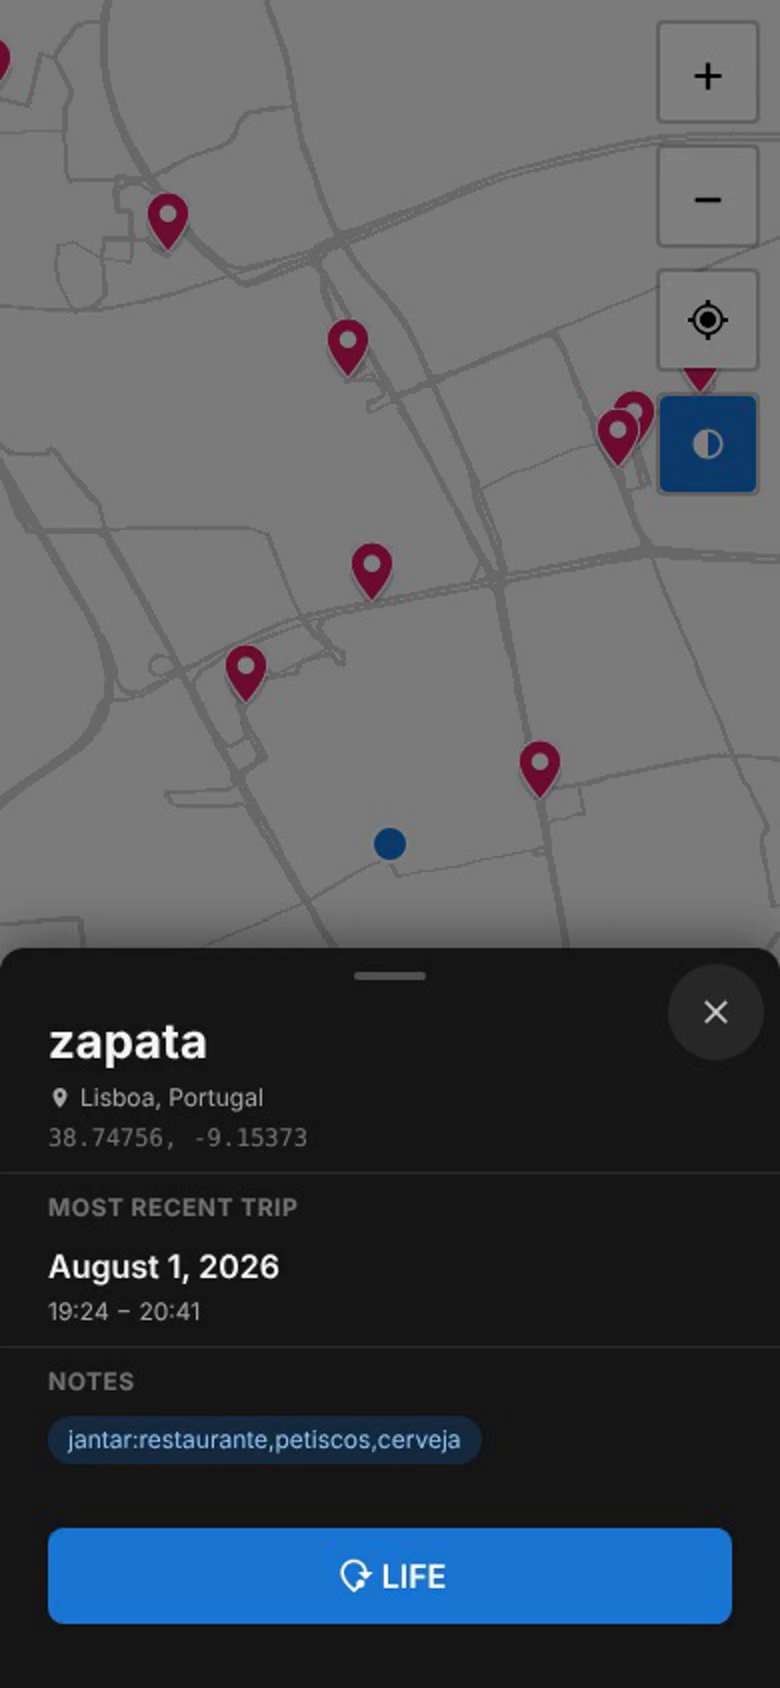
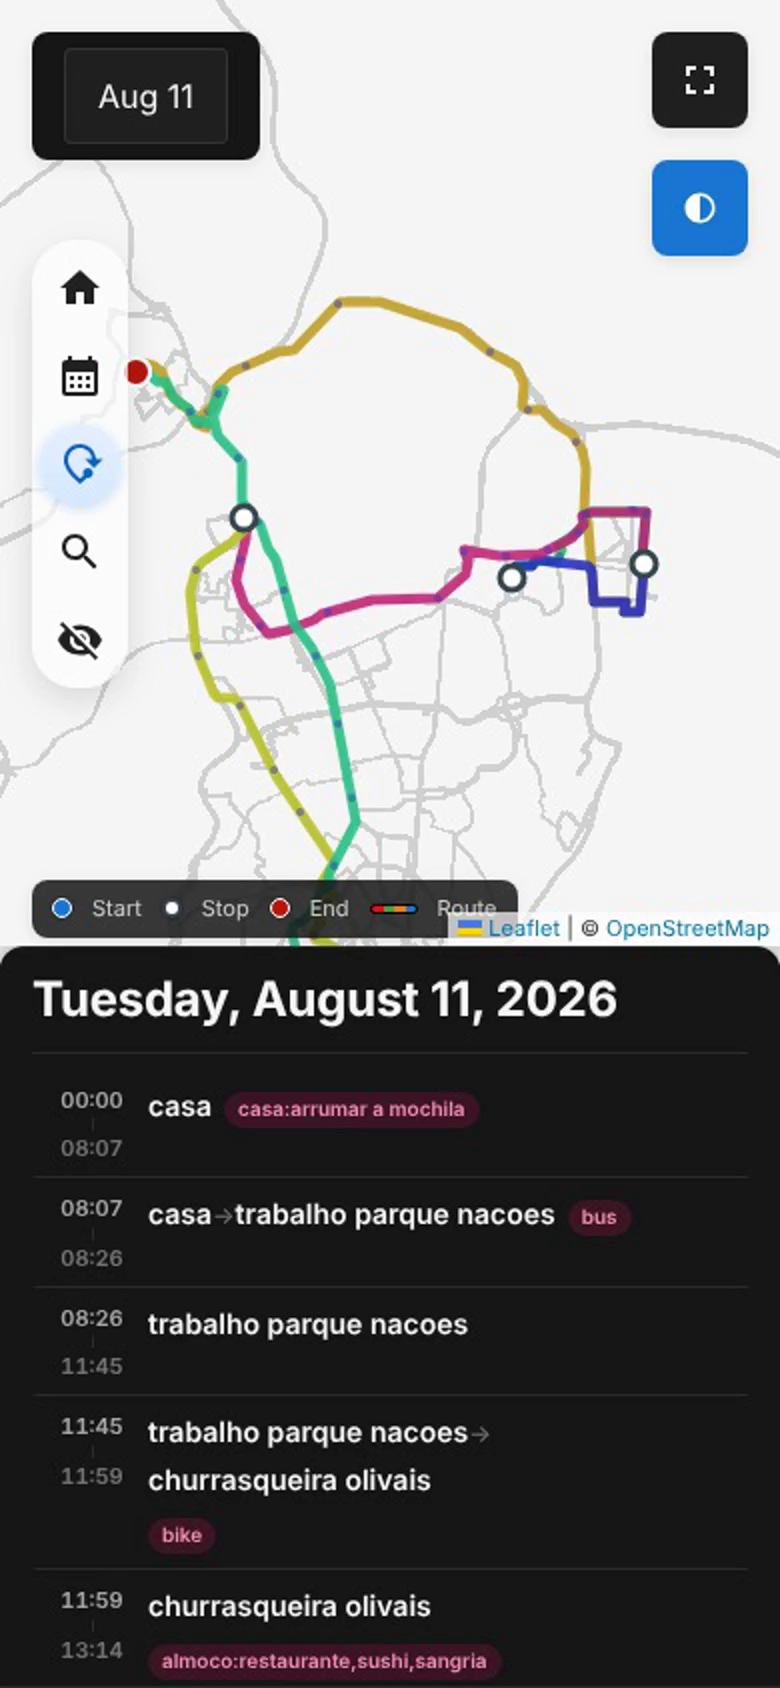
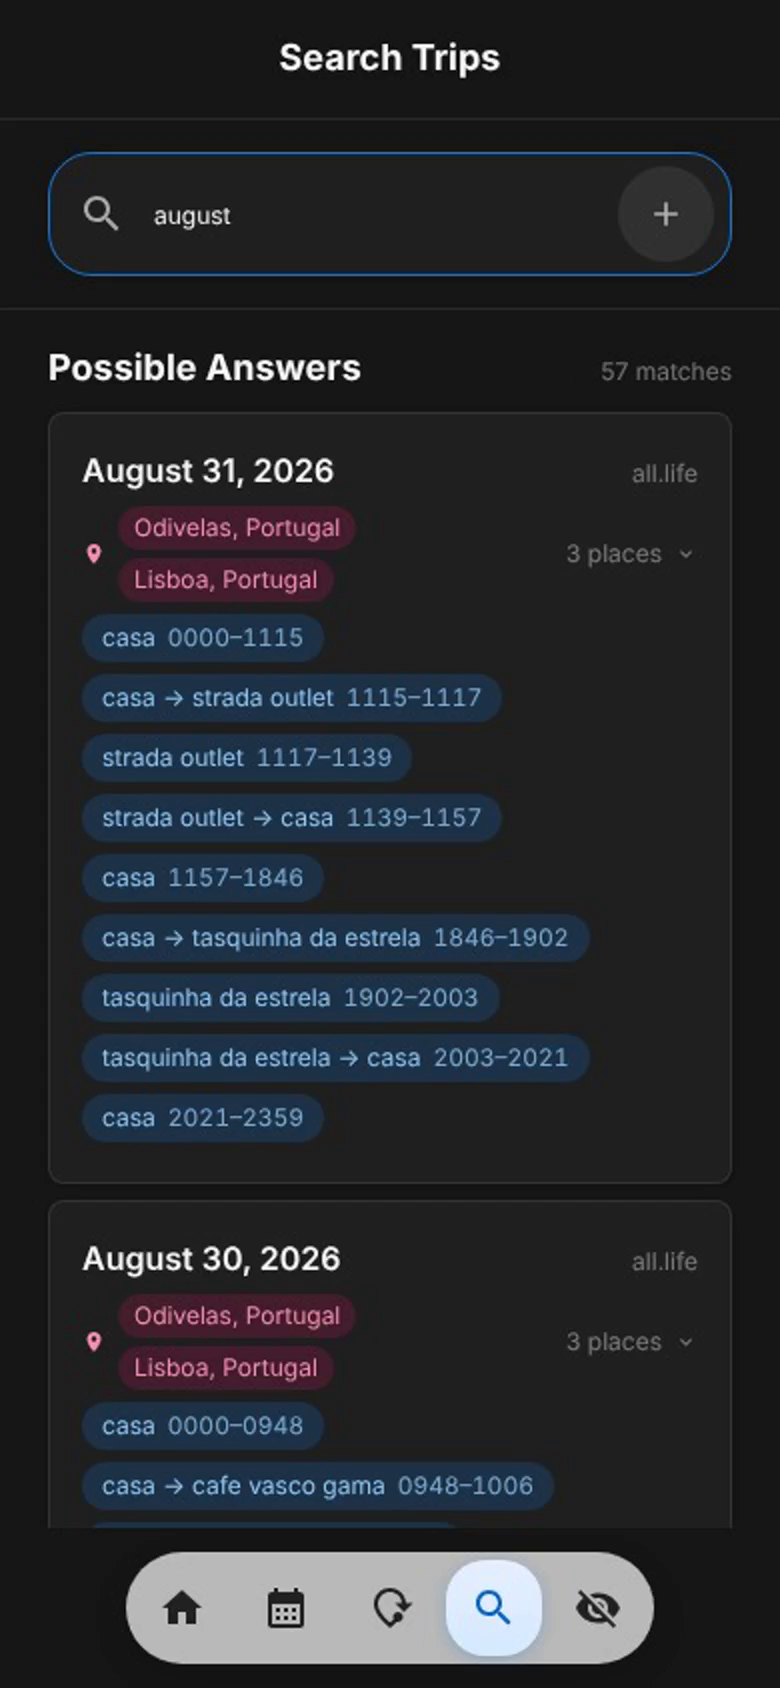
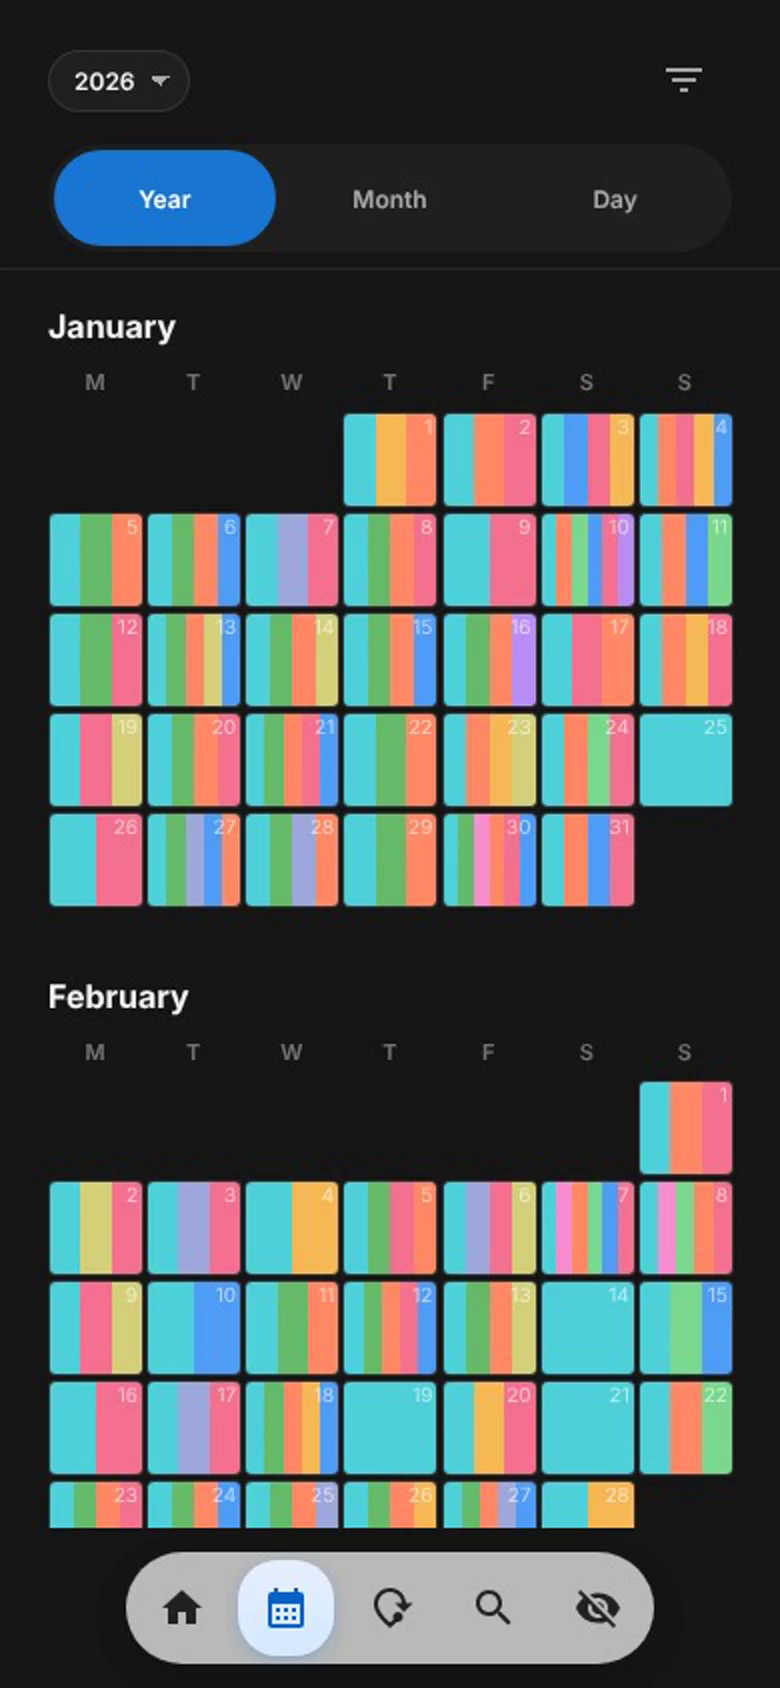
Screens of the running app on the synthetic dataset used in the study (the background map is simplified).
What we built
The app shares the backend and the data model of MySteps and adds only two endpoints and no database change. A PWA lets us reuse that backend and the Redux logic, install the app on the home screen, and keep it usable offline. Four screens, one per kind of question:
- Map: a map centred on you, with every place you have visited and a card for the nearest one and your last visit there.
- Calendar: year, month and day views where each day is a row of coloured stripes, so patterns are visible before any detail.
- LIFE view: a day shown twice, as a GPS track and as what you wrote about it, linked in both directions. When the two disagree, the interface shows the disagreement instead of hiding it.
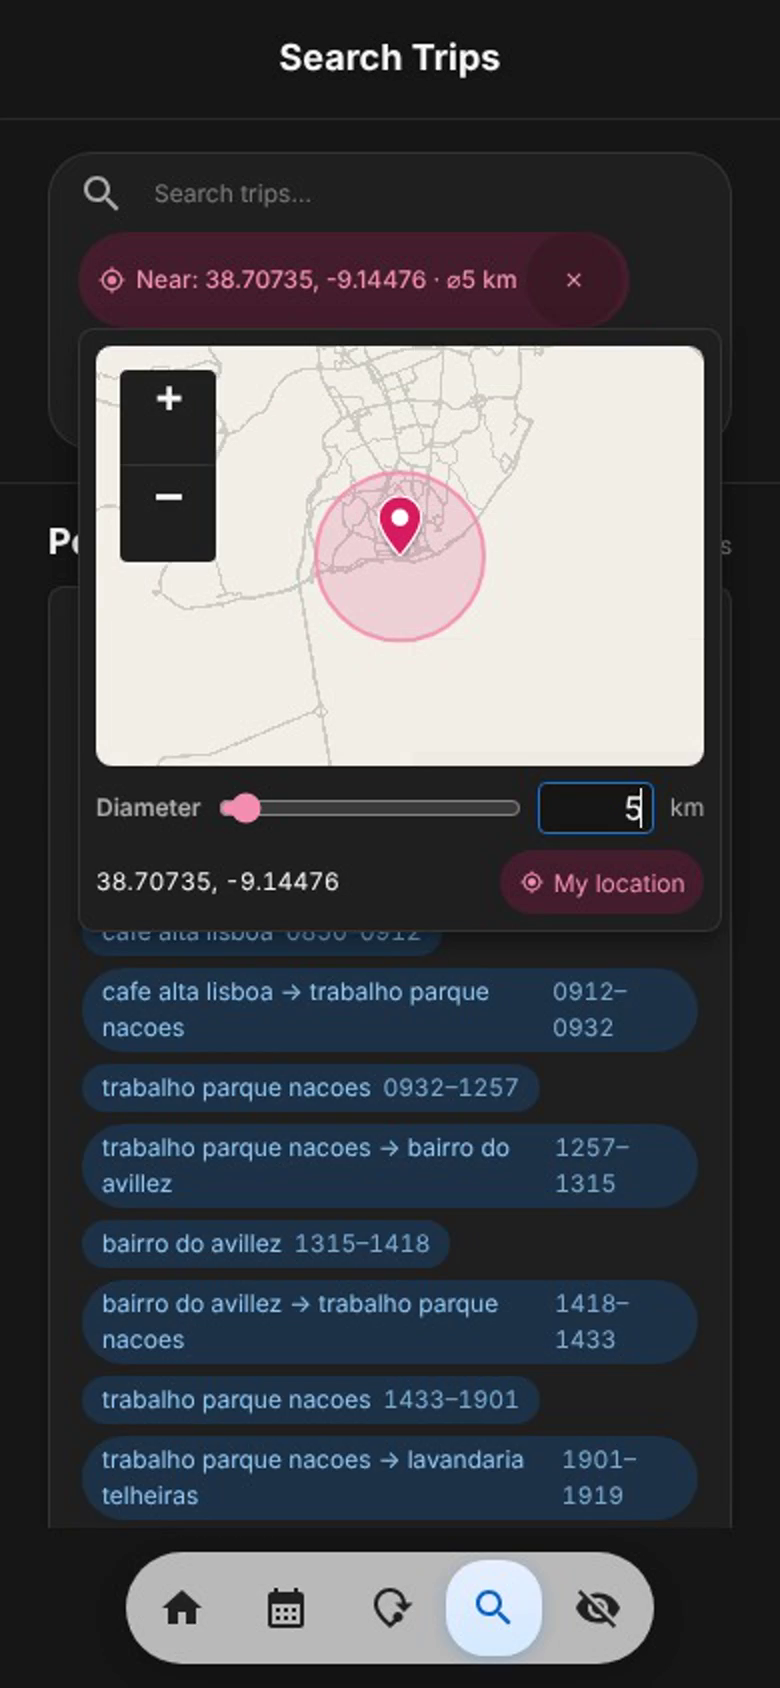
- Search: filter blocks and free text reduced to the same kind of constraint, plus a geographic block: tap a point on the map and choose a diameter.
The design started on paper and moved to Figma before any code. The sketches decided the screens and the paths between them; the Figma prototype fixed the look and the interactions.
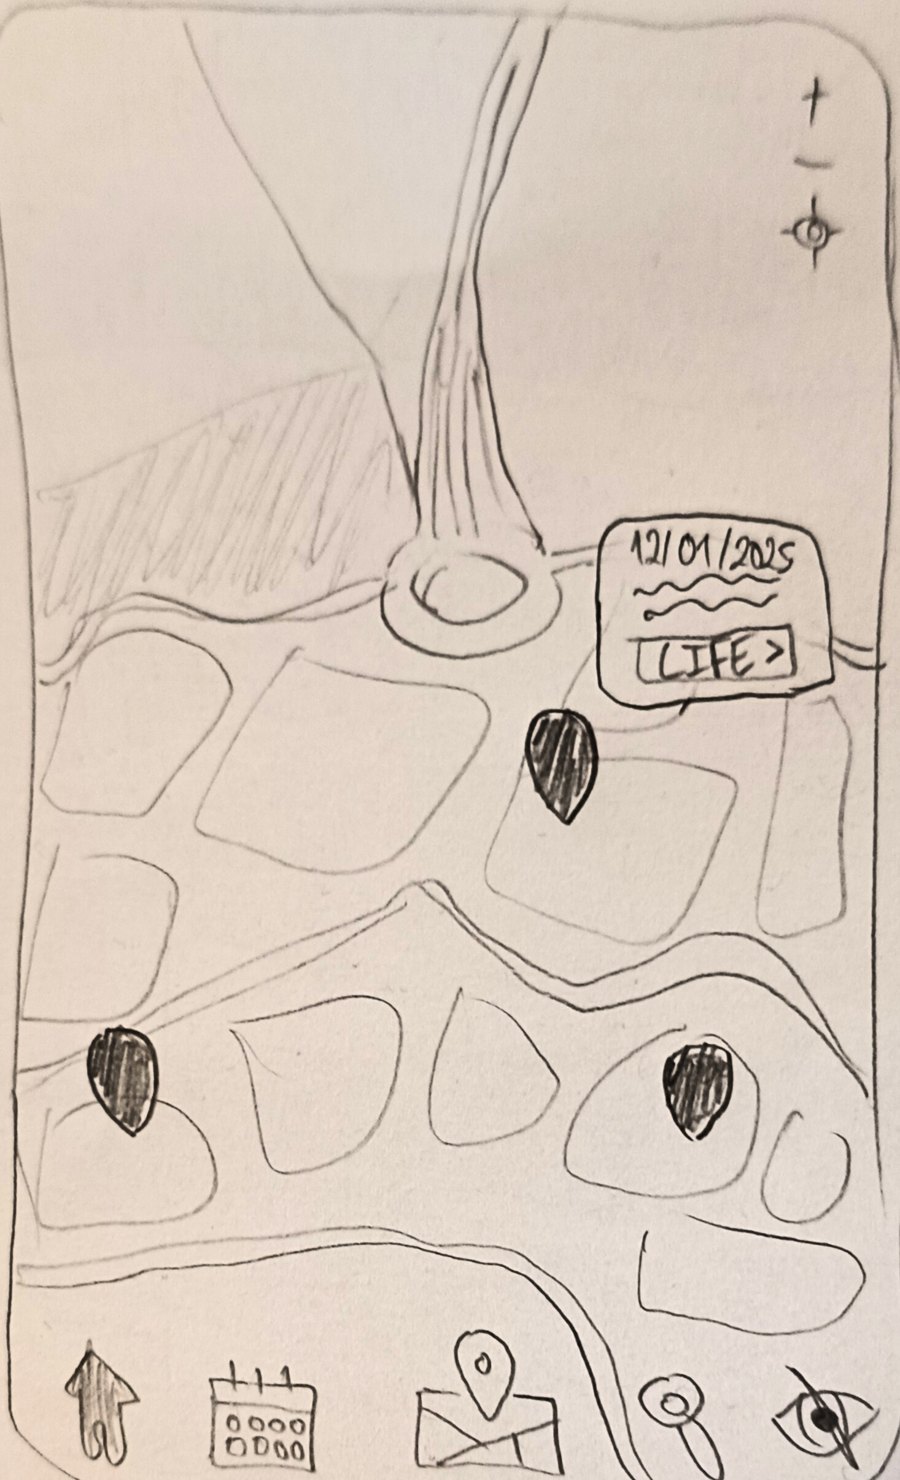
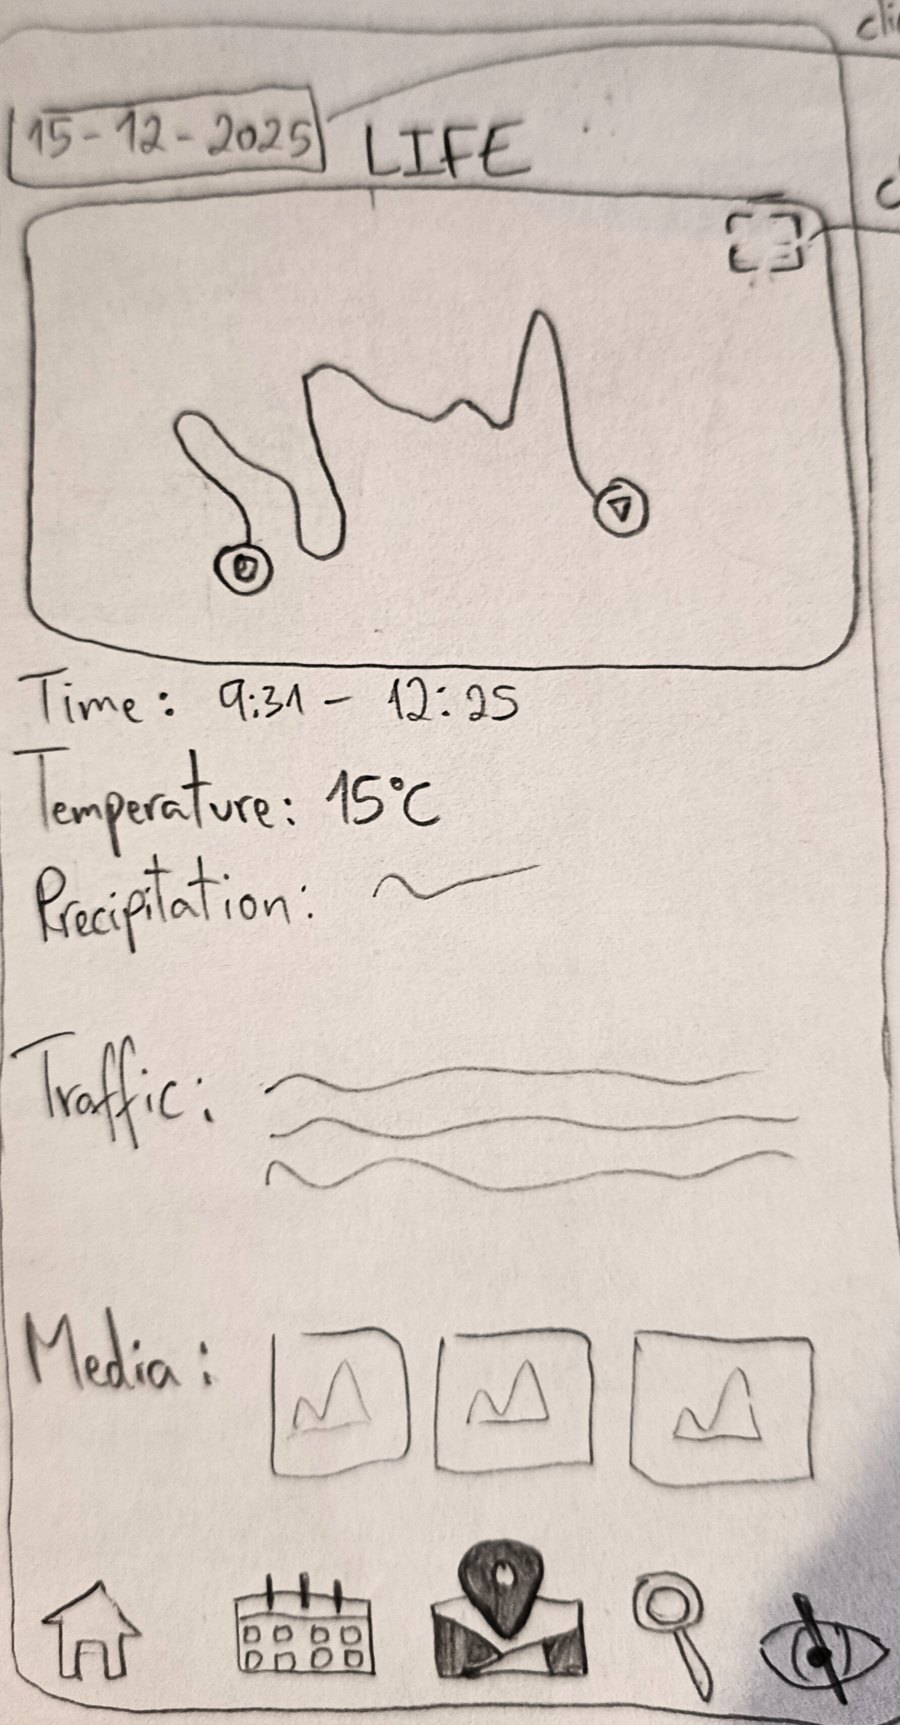
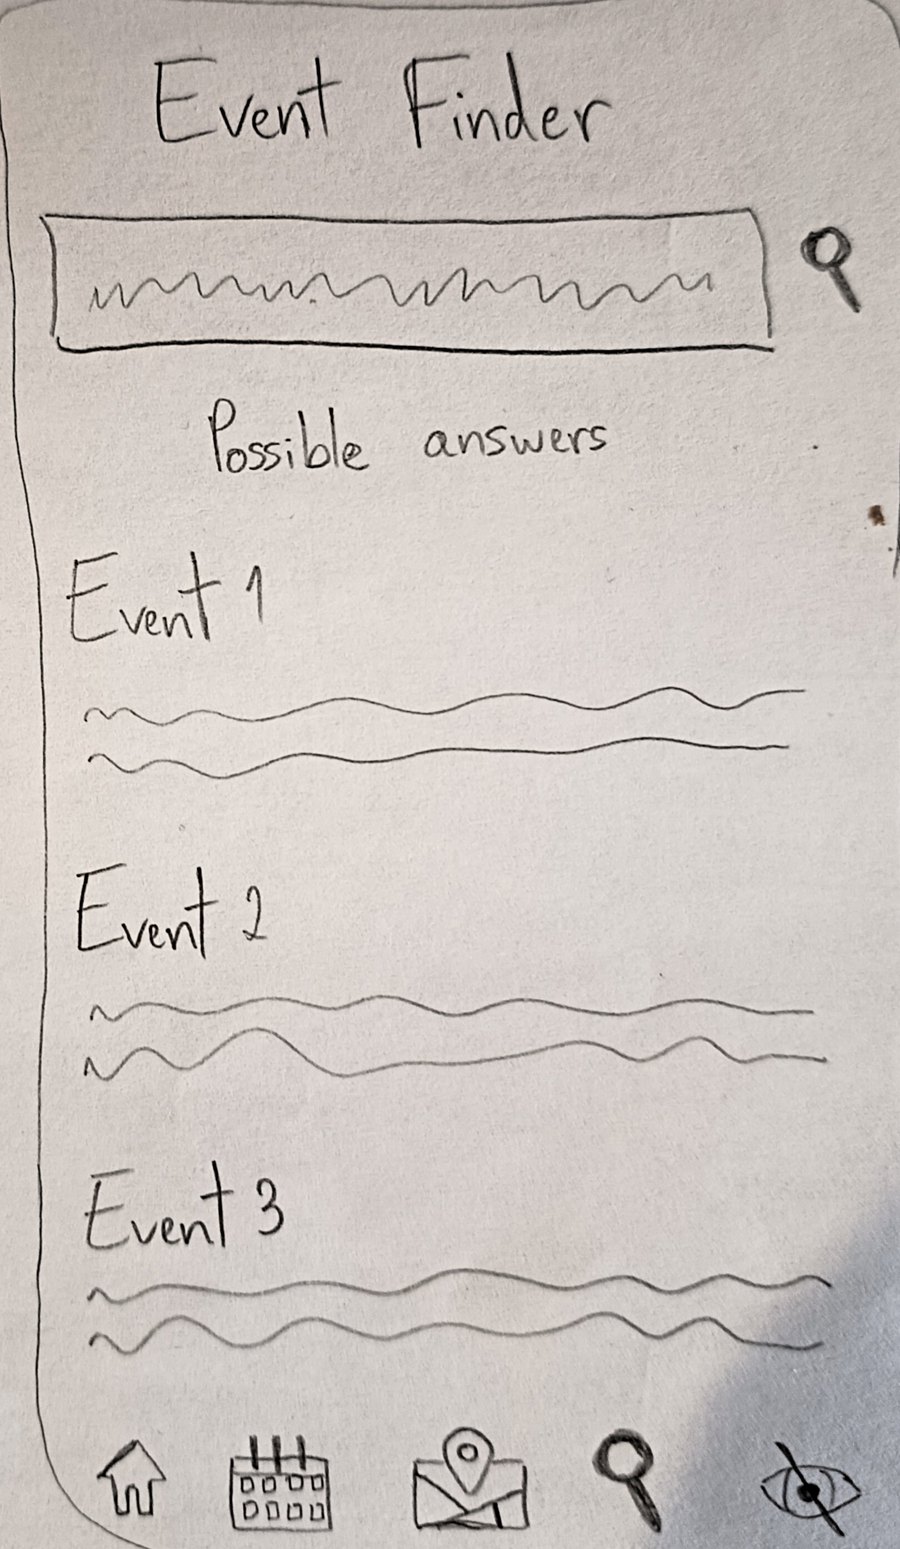
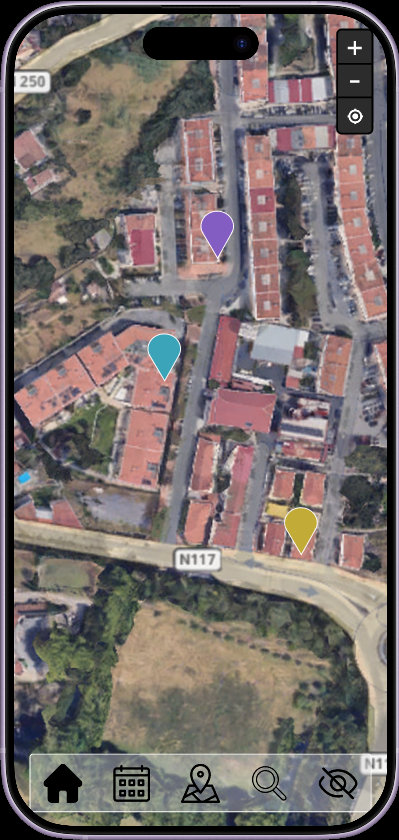
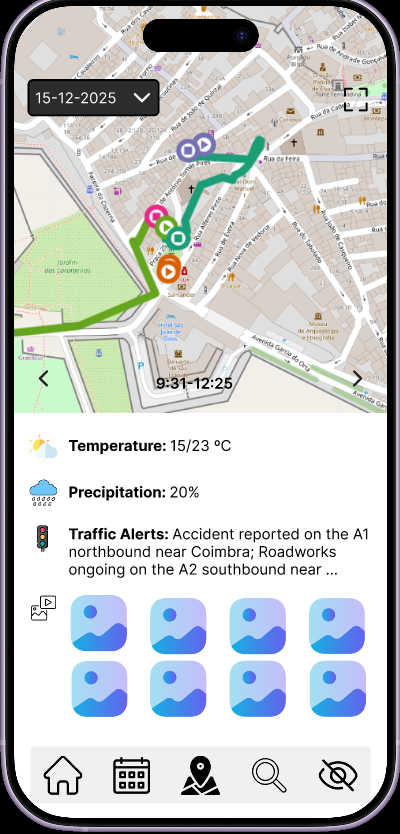
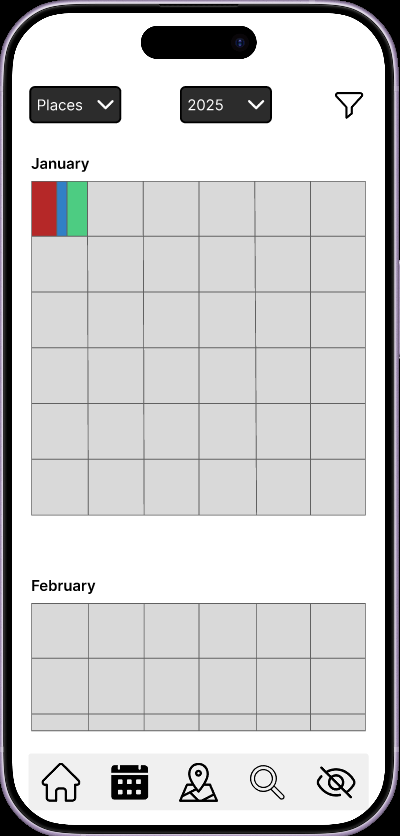
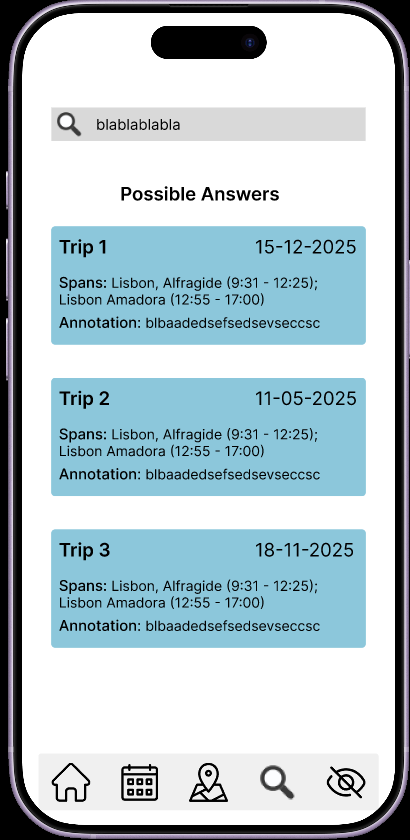
Hand sketches (top) and the Figma prototype (bottom). The prototype still planned weather, news and traffic in the LIFE view; they were dropped in the implementation.
A short scenario shows the screens working together. A friend asks for "that restaurant in the market by the river". You remember the evening but not the name or the date. You search near the Cais do Sodré for dinners in August, find the 11th, open the day and see Time Out Market, 20:12 to 22:01:
The scenario on the study dataset, sped up 1.3 times.
Where the data comes from
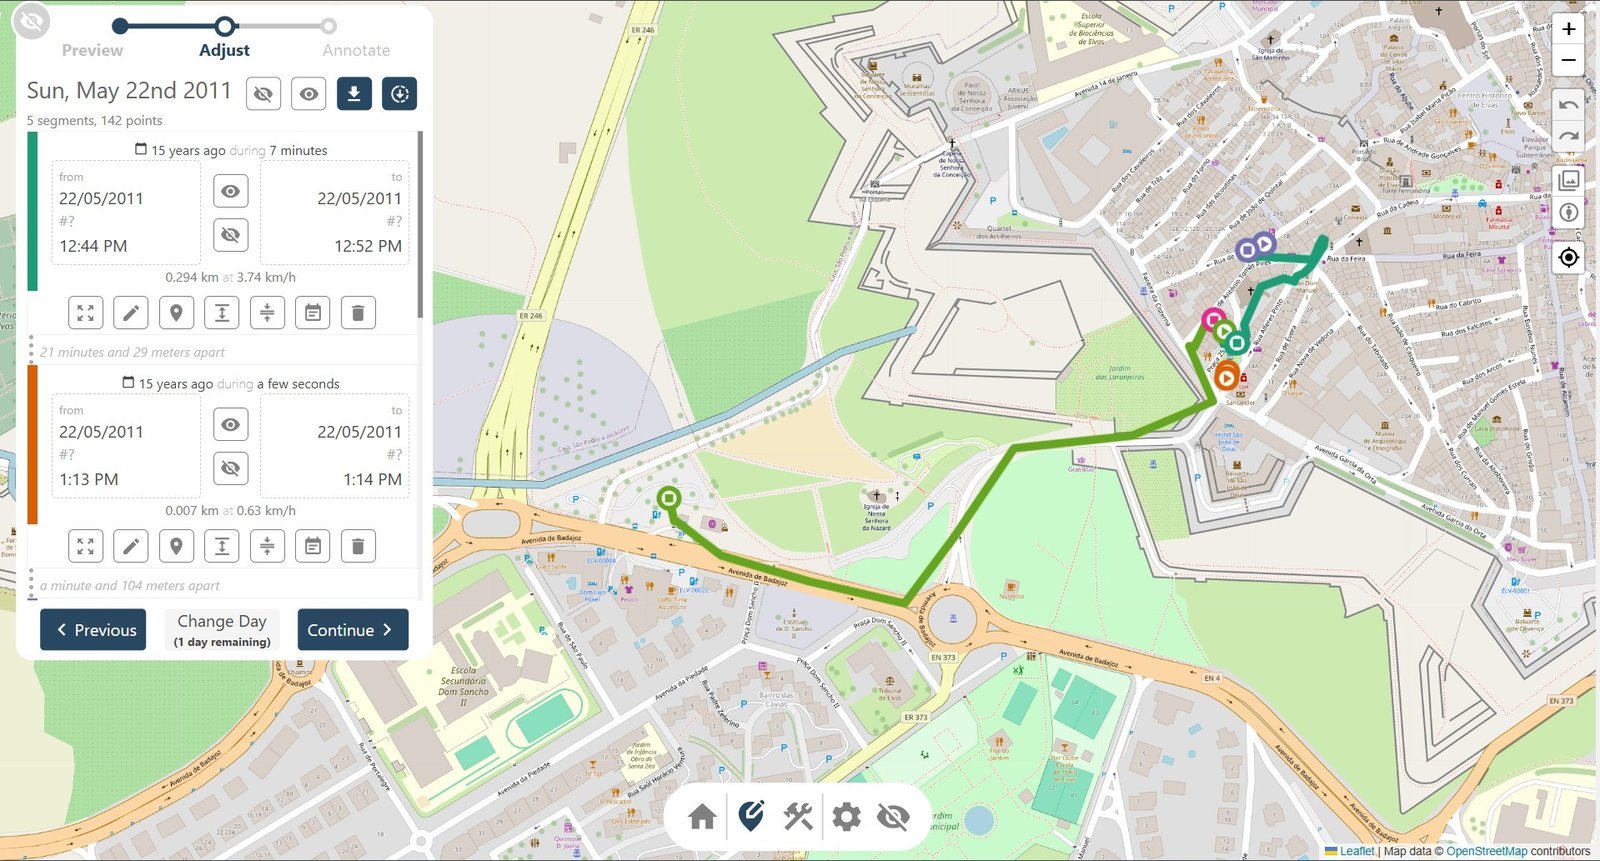
MySteps is a desktop web platform that processes personal GPS traces and lets users annotate them. Retrace MySteps reuses its backend, data model and state.
What we found
Fifteen participants, mostly outside computer science, got a short demonstration of what the app stores but no instruction on how to operate it. They then did nine tasks on a real Android phone, each asking for one fact about a fictional person's record, with 180 seconds per task and the order balanced with a Williams design.
- They gave the correct answer in 105 of 135 attempts (77.8%). Three tasks were solved by everyone.
- Usability was rated good (mean SUS 81.2), and the workload was low (NASA-TLX 31, below the literature mean of 42).
- Two tasks were solved by only 6 of 15 people: filtering the calendar by annotation, and combining a place filter with an annotation filter in the search. A third, finding the longest journey of a day in the LIFE view, was solved by 10 of 15.
- Of the 30 failures, 20 were confident wrong answers and only 10 were timeouts.
What went wrong was in the interface. Search result cards did not show which annotation had matched, results were ordered by relevance rather than date, and the calendar filters were easy to miss. In the LIFE view, stays and journeys were hard to tell apart and durations were not shown. The main lesson is that search results must explain why they matched.
Try the app
Below is the real Retrace MySteps, running in this page on the study dataset: a fictional person with 400 days of GPS tracks and LIFE records in Lisbon. You are standing at a friend's house in Queluz. Follow the dinner scenario, or just explore. (The base map here is Esri's street map, not the OpenStreetMap one used in the real app.)
This is the real app, running in your page on the study dataset (a fictional person, 400 days in Lisbon). You are at a friend's house in Queluz.
- Home: the nearest place you have been, and when.
- Search: add a Near block around Cais do Sodré (2 km) and an Annotation block jantar, then type august 2026.
- Open 11 August and tap the dinner.
- Calendar: filter by the tag jantar.
Note: the base map in this demo is not the one used in the real app (OpenStreetMap); here it is Esri's street map.
Searching by place works with a point and a diameter instead of a name. The diameter matters: from one point on this dataset, 5 km finds 2 days, 10 km finds 9, 25 km finds 260 and 50 km finds all 400. Open the app full screen.
Limitations and what is next
The data were not the participants' own, the sample was small and everyone knew the moderator, and the study was a controlled session rather than a walk in the street. The interface is in English only, and free-text search has no typo tolerance. Next: show what matched on every result card and sort by date, simplify the calendar filters into a single selection filter, tell stays from journeys and show durations, and run a longitudinal study with participants' own data.